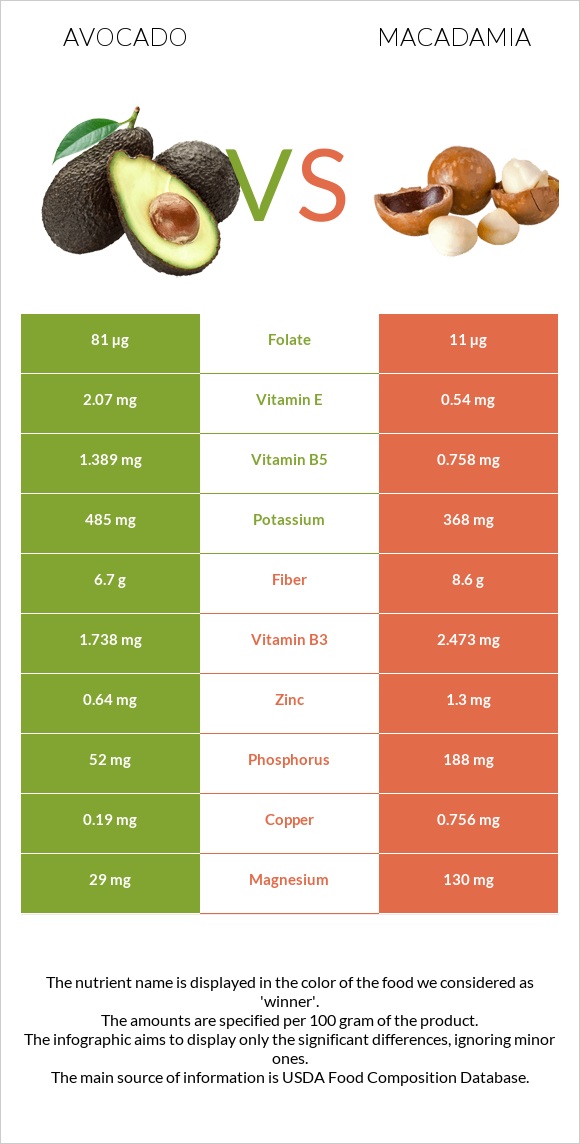
How are avocados and macadamia different? Avocados are richer in folate, vitamin B5, and vitamin E, while macadamia is higher in manganese, vitamin B1, copper, iron, magnesium, and phosphorus. Macadamia covers your daily need for manganese, 173% more than avocados. Avocados contain 7 times more folate than macadamia. Avocados contain 81µg of folate, while macadamia contains 11µg. Avocados are lower in saturated fat. Avocados have a higher glycemic index (40) than macadamia (10). Avocados, raw, all commercial varieties and Nuts, macadamia nuts, raw types were used in this article.
Infographic
Mineral Comparison
Mineral comparison score is based on the number of minerals by which one or the other food is richer. The "coverage" charts below show how much of the daily needs can be covered by 300 grams of the food.
1
100 g
300 g
1 cup, sliced - 146g 1 cup, cubes - 150g 1 avocado, NS as to Florida or California - 201g 1 cup, pureed - 230g
Magnesium
Magnesium
Calcium
Calcium
Potassium
Potassium
Iron
Iron
Copper
Copper
Zinc
Zinc
Phosphorus
Phosphorus
Sodium
Sodium
Manganese
Manganese
Selenium
Selenium
21%
3.6%
43%
21%
63%
17%
22%
0.91%
19%
2.2%
9
100 g
300 g
1 oz (10-12 kernels) - 28.35g 1 cup, whole or halves - 134g
Magnesium
Magnesium
Calcium
Calcium
Potassium
Potassium
Iron
Iron
Copper
Copper
Zinc
Zinc
Phosphorus
Phosphorus
Sodium
Sodium
Manganese
Manganese
Selenium
Selenium
93%
26%
32%
138%
252%
35%
81%
0.65%
539%
20%
Vitamin Comparison
Vitamin comparison score is based on the number of vitamins by which one or the other food is richer. The "coverage" charts below show how much of the daily needs can be covered by 300 grams of the food.
6
100 g
300 g
1 cup, sliced - 146g 1 cup, cubes - 150g 1 avocado, NS as to Florida or California - 201g 1 cup, pureed - 230g
Vitamin C
Vit. C
Vitamin D
Vit. D
Vitamin A
Vit. A
Vitamin E
Vit. E
Vitamin B1
Vit. B1
Vitamin B2
Vit. B2
Vitamin B3
Vit. B3
Vitamin B5
Vit. B5
Vitamin B6
Vit. B6
Vitamin B12
Vit. B12
Vitamin K
Vit. K
Folate
Folate
33%
0%
2.3%
41%
17%
30%
33%
83%
59%
0%
53%
61%
3
100 g
300 g
1 oz (10-12 kernels) - 28.35g 1 cup, whole or halves - 134g
Vitamin C
Vit. C
Vitamin D
Vit. D
Vitamin A
Vit. A
Vitamin E
Vit. E
Vitamin B1
Vit. B1
Vitamin B2
Vit. B2
Vitamin B3
Vit. B3
Vitamin B5
Vit. B5
Vitamin B6
Vit. B6
Vitamin B12
Vit. B12
Vitamin K
Vit. K
Folate
Folate
4%
0%
0%
11%
299%
37%
46%
45%
63%
0%
0%
8.3%
All nutrients comparison - raw data values
Nutrient
DV% diff.
Manganese
0.142mg
4.131mg
173%
Monounsaturated fat
9.799g
58.877g
123%
Fats
14.66g
75.77g
94%
Vitamin B1
0.067mg
1.195mg
94%
Copper
0.19mg
0.756mg
63%
Saturated fat
2.126g
12.061g
45%
Iron
0.55mg
3.69mg
39%
Calories
160kcal
718kcal
28%
Magnesium
29mg
130mg
24%
Phosphorus
52mg
188mg
19%
Vitamin K
21µg
18%
Folate
81µg
11µg
18%
Vitamin B5
1.389mg
0.758mg
13%
Protein
2g
7.91g
12%
Vitamin C
10mg
1.2mg
10%
Vitamin E
2.07mg
0.54mg
10%
Fiber
6.7g
8.6g
8%
Calcium
12mg
85mg
7%
Zinc
0.64mg
1.3mg
6%
Selenium
0.4µg
3.6µg
6%
Vitamin B3
1.738mg
2.473mg
5%
Potassium
485mg
368mg
3%
Choline
14.2mg
3%
Carbs
8.53g
13.82g
2%
Vitamin B2
0.13mg
0.162mg
2%
Polyunsaturated fat
1.816g
1.502g
2%
Vitamin A
7µg
0µg
1%
Vitamin B6
0.257mg
0.275mg
1%
Protein per 100 calories
1.3g
1.1g
N/A
Calories per 10 g protein
800kcal
908kcal
N/A
Weight per 100 calories
63g
14g
N/A
Unsaturated / Saturated Fat ratio
5.5
5
N/A
Net carbs
1.83g
5.22g
N/A
Sugar
0.66g
4.57g
N/A
Starch
0.11g
1.05g
0%
Sodium
7mg
5mg
0%
Tryptophan
0.025mg
0.067mg
0%
Threonine
0.073mg
0.37mg
0%
Isoleucine
0.084mg
0.314mg
0%
Leucine
0.143mg
0.602mg
0%
Lysine
0.132mg
0.018mg
0%
Methionine
0.038mg
0.023mg
0%
Phenylalanine
0.097mg
0.665mg
0%
Valine
0.107mg
0.363mg
0%
Histidine
0.049mg
0.195mg
0%
Fructose
0.12g
0.07g
0%
Omega-3 - ALA
0.111g
N/A
Omega-6 - Gamma-linoleic acid
0.015g
N/A
Macronutrient Comparison
Macronutrient breakdown side-by-side comparison
2
2%
15%
9%
73%
Protein:
2 g
Fats:
14.66 g
Carbs:
8.53 g
Water:
73.23 g
Other:
1.58 g
3
8%
76%
14%
Protein:
7.91 g
Fats:
75.77 g
Carbs:
13.82 g
Water:
1.36 g
Other:
1.14 g
Contains
more
Water Water
+5284.6%
Contains
more
Other Other
+38.6%
Contains
more
Protein Protein
+295.5%
Contains
more
Fats Fats
+416.8%
Contains
more
Carbs Carbs
+62%
Fat Type Comparison
Fat type breakdown side-by-side comparison
2
15%
71%
13%
Saturated fat:
Sat. Fat
2.126 g
Monounsaturated fat:
Mono. Fat
9.799 g
Polyunsaturated fat:
Poly. Fat
1.816 g
1
17%
81%
2%
Saturated fat:
Sat. Fat
12.061 g
Monounsaturated fat:
Mono. Fat
58.877 g
Polyunsaturated fat:
Poly. Fat
1.502 g
Contains
less
Sat. Fat Saturated fat
-82.4%
Contains
more
Poly. Fat Polyunsaturated fat
+20.9%
Contains
more
Mono. Fat Monounsaturated fat
+500.8%
Carbohydrate type comparison
Carbohydrate type breakdown side-by-side comparison
3
14%
8%
49%
16%
13%
Starch:
0.11 g
Sucrose:
0.06 g
Glucose:
0.37 g
Fructose:
0.12 g
Lactose:
0 g
Maltose:
0 g
Galactose:
0.1 g
2
19%
79%
Starch:
1.05 g
Sucrose:
4.43 g
Glucose:
0.07 g
Fructose:
0.07 g
Lactose:
0 g
Maltose:
0 g
Galactose:
0 g
Contains
more
Glucose Glucose
+428.6%
Contains
more
Fructose Fructose
+71.4%
Contains
more
Galactose Galactose
+∞%
Contains
more
Starch Starch
+854.5%
Contains
more
Sucrose Sucrose
+7283.3%
~equal in
Lactose
~0g
~equal in
Maltose
~0g