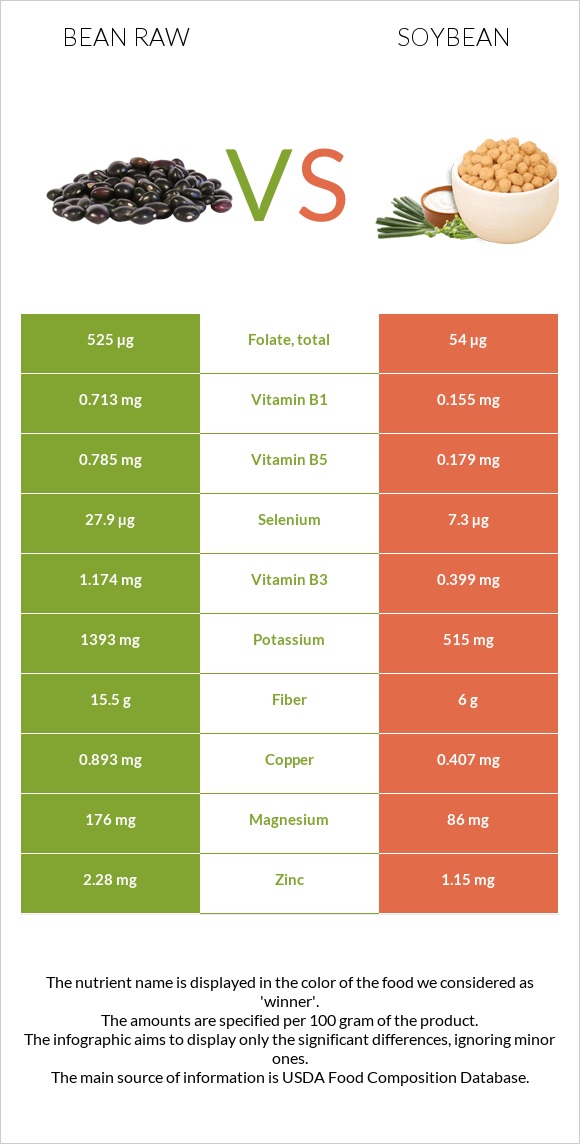
Differences between bean raw and soybeans Soybeans contain less folate, copper, vitamin B1, fiber, selenium, potassium, phosphorus, magnesium, vitamin B6, and manganese than bean raw. Bean raw's daily need coverage for folate is 118% higher. Soybeans contain 5 times less vitamin B1 than bean raw. Bean raw contains 0.713mg of vitamin B1, while soybeans contain 0.155mg. Soybeans have a lower glycemic index. The glycemic index of soybeans is 14, while the glycemic index of bean raw is 33. The food types used in this comparison are Beans, pinto, mature seeds, raw and Soybeans, mature cooked, boiled, without salt .
Infographic
Mineral Comparison
Mineral comparison score is based on the number of minerals by which one or the other food is richer. The "coverage" charts below show how much of the daily needs can be covered by 300 grams of the food.
7
100 g
300 g
1 tbsp - 12g 1 cup - 193g
Magnesium
Magnesium
Calcium
Calcium
Potassium
Potassium
Iron
Iron
Copper
Copper
Zinc
Zinc
Phosphorus
Phosphorus
Sodium
Sodium
Manganese
Manganese
Selenium
Selenium
126%
34%
123%
190%
298%
62%
176%
1.6%
150%
152%
1
100 g
300 g
1 tbsp - 10.7g 1 cup - 172g
Magnesium
Magnesium
Calcium
Calcium
Potassium
Potassium
Iron
Iron
Copper
Copper
Zinc
Zinc
Phosphorus
Phosphorus
Sodium
Sodium
Manganese
Manganese
Selenium
Selenium
61%
31%
45%
193%
136%
31%
105%
0.13%
107%
40%
Vitamin Comparison
Vitamin comparison score is based on the number of vitamins by which one or the other food is richer. The "coverage" charts below show how much of the daily needs can be covered by 300 grams of the food.
6
100 g
300 g
1 tbsp - 12g 1 cup - 193g
Vitamin C
Vit. C
Vitamin D
Vit. D
Vitamin A
Vit. A
Vitamin E
Vit. E
Vitamin B1
Vit. B1
Vitamin B2
Vit. B2
Vitamin B3
Vit. B3
Vitamin B5
Vit. B5
Vitamin B6
Vit. B6
Vitamin B12
Vit. B12
Vitamin K
Vit. K
Folate
Folate
21%
0%
0%
4.2%
178%
49%
22%
47%
109%
0%
14%
394%
3
100 g
300 g
1 tbsp - 10.7g 1 cup - 172g
Vitamin C
Vit. C
Vitamin D
Vit. D
Vitamin A
Vit. A
Vitamin E
Vit. E
Vitamin B1
Vit. B1
Vitamin B2
Vit. B2
Vitamin B3
Vit. B3
Vitamin B5
Vit. B5
Vitamin B6
Vit. B6
Vitamin B12
Vit. B12
Vitamin K
Vit. K
Folate
Folate
5.7%
0%
0%
7%
39%
66%
7.5%
11%
54%
0%
48%
41%
All nutrients comparison - raw data values
Nutrient
DV% diff.
Folate
525µg
54µg
118%
Copper
0.893mg
0.407mg
54%
Vitamin B1
0.713mg
0.155mg
47%
Fiber
15.5g
6g
38%
Selenium
27.9µg
7.3µg
37%
Polyunsaturated fat
0.407g
5.064g
31%
Potassium
1393mg
515mg
26%
Phosphorus
411mg
245mg
24%
Magnesium
176mg
86mg
21%
Carbs
62.55g
8.36g
18%
Vitamin B6
0.474mg
0.234mg
18%
Starch
34.17g
14%
Manganese
1.148mg
0.824mg
14%
Fats
1.23g
8.97g
12%
Vitamin B5
0.785mg
0.179mg
12%
Vitamin K
5.6µg
19.2µg
11%
Zinc
2.28mg
1.15mg
10%
Calories
347kcal
172kcal
9%
Protein
21.42g
18.21g
6%
Vitamin B2
0.212mg
0.285mg
6%
Vitamin C
6.3mg
1.7mg
5%
Vitamin B3
1.174mg
0.399mg
5%
Saturated fat
0.235g
1.297g
5%
Monounsaturated fat
0.229g
1.981g
4%
Choline
66.2mg
47.5mg
3%
Calcium
113mg
102mg
1%
Iron
5.07mg
5.14mg
1%
Vitamin E
0.21mg
0.35mg
1%
Protein per 100 calories
6.2g
11g
N/A
Calories per 10 g protein
162kcal
94kcal
N/A
Weight per 100 calories
29g
58g
N/A
Unsaturated / Saturated Fat ratio
2.7
5.4
N/A
Net carbs
47.05g
2.36g
N/A
Sugar
2.11g
3g
N/A
Sodium
12mg
1mg
0%
Tryptophan
0.237mg
0.242mg
0%
Threonine
0.81mg
0.723mg
0%
Isoleucine
0.871mg
0.807mg
0%
Leucine
1.558mg
1.355mg
0%
Lysine
1.356mg
1.108mg
0%
Methionine
0.259mg
0.224mg
0%
Phenylalanine
1.095mg
0.869mg
0%
Valine
0.998mg
0.831mg
0%
Histidine
0.556mg
0.449mg
0%
Macronutrient Comparison
Macronutrient breakdown side-by-side comparison
3
21%
63%
11%
3%
Protein:
21.42 g
Fats:
1.23 g
Carbs:
62.55 g
Water:
11.33 g
Other:
3.47 g
2
18%
9%
8%
63%
2%
Protein:
18.21 g
Fats:
8.97 g
Carbs:
8.36 g
Water:
62.55 g
Other:
1.91 g
Contains
more
Protein Protein
+17.6%
Contains
more
Carbs Carbs
+648.2%
Contains
more
Other Other
+81.7%
Contains
more
Fats Fats
+629.3%
Contains
more
Water Water
+452.1%
Fat Type Comparison
Fat type breakdown side-by-side comparison
1
27%
26%
47%
Saturated fat:
Sat. Fat
0.235 g
Monounsaturated fat:
Mono. Fat
0.229 g
Polyunsaturated fat:
Poly. Fat
0.407 g
2
16%
24%
61%
Saturated fat:
Sat. Fat
1.297 g
Monounsaturated fat:
Mono. Fat
1.981 g
Polyunsaturated fat:
Poly. Fat
5.064 g
Contains
less
Sat. Fat Saturated fat
-81.9%
Contains
more
Mono. Fat Monounsaturated fat
+765.1%
Contains
more
Poly. Fat Polyunsaturated fat
+1144.2%