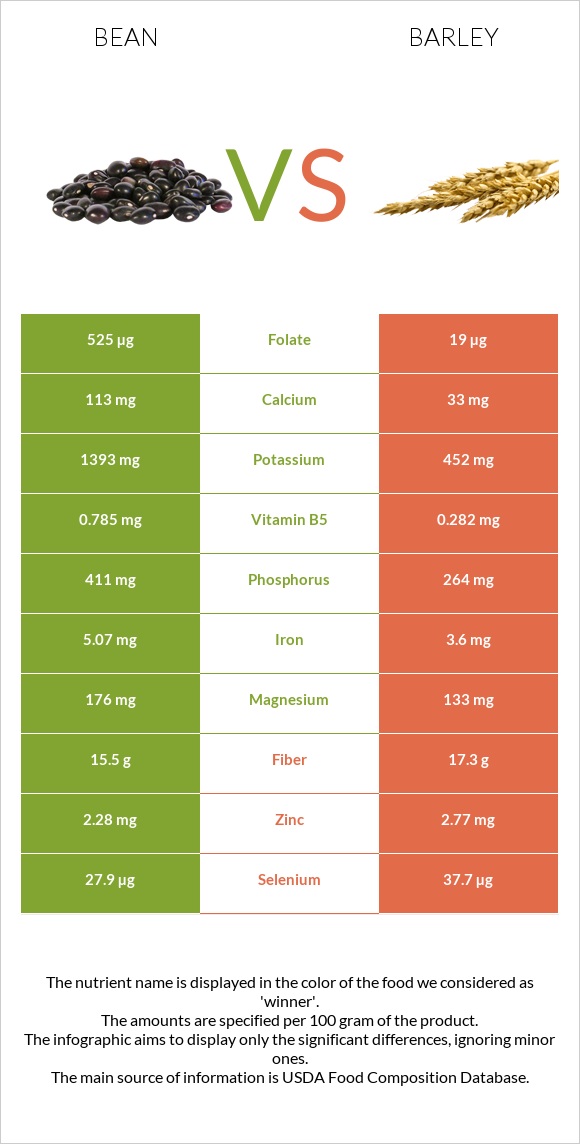
Summary of differences between beans and barley Beans have less selenium, fiber, iron, vitamin B1, copper, vitamin B3, magnesium, phosphorus, vitamin B2, and vitamin B6 than barley. Barley covers your daily need for selenium, 60% more than beans. These are the specific foods used in this comparison Beans, baked, canned, no salt added and Barley, hulled .
Infographic
Mineral Comparison
Mineral comparison score is based on the number of minerals by which one or the other food is richer. The "coverage" charts below show how much of the daily needs can be covered by 300 grams of the food.
2
100 g
300 g
1 cup - 253g
Magnesium
Magnesium
Calcium
Calcium
Potassium
Potassium
Iron
Iron
Copper
Copper
Zinc
Zinc
Phosphorus
Phosphorus
Sodium
Sodium
Manganese
Manganese
Selenium
Selenium
23%
15%
26%
11%
69%
38%
45%
0.13%
0%
25%
8
100 g
300 g
1 cup - 184g
Magnesium
Magnesium
Calcium
Calcium
Potassium
Potassium
Iron
Iron
Copper
Copper
Zinc
Zinc
Phosphorus
Phosphorus
Sodium
Sodium
Manganese
Manganese
Selenium
Selenium
95%
9.9%
40%
135%
166%
76%
113%
1.6%
253%
206%
Vitamin Comparison
Vitamin comparison score is based on the number of vitamins by which one or the other food is richer. The "coverage" charts below show how much of the daily needs can be covered by 300 grams of the food.
3
100 g
300 g
1 cup - 253g
Vitamin C
Vit. C
Vitamin D
Vit. D
Vitamin A
Vit. A
Vitamin E
Vit. E
Vitamin B1
Vit. B1
Vitamin B2
Vit. B2
Vitamin B3
Vit. B3
Vitamin B5
Vit. B5
Vitamin B6
Vit. B6
Vitamin B12
Vit. B12
Vitamin K
Vit. K
Folate
Folate
10%
0%
1.7%
3%
38%
14%
8.1%
0%
30%
0%
2%
18%
7
100 g
300 g
1 cup - 184g
Vitamin C
Vit. C
Vitamin D
Vit. D
Vitamin A
Vit. A
Vitamin E
Vit. E
Vitamin B1
Vit. B1
Vitamin B2
Vit. B2
Vitamin B3
Vit. B3
Vitamin B5
Vit. B5
Vitamin B6
Vit. B6
Vitamin B12
Vit. B12
Vitamin K
Vit. K
Folate
Folate
0%
0%
0.33%
11%
162%
66%
86%
17%
73%
0%
5.5%
14%
All nutrients comparison - raw data values
Nutrient
DV% diff.
Manganese
1.943mg
84%
Selenium
4.5µg
37.7µg
60%
Fiber
5.5g
17.3g
47%
Iron
0.29mg
3.6mg
41%
Vitamin B1
0.15mg
0.646mg
41%
Copper
0.206mg
0.498mg
32%
Vitamin B3
0.43mg
4.604mg
26%
Magnesium
32mg
133mg
24%
Phosphorus
104mg
264mg
23%
Carbs
20.49g
73.48g
18%
Vitamin B2
0.06mg
0.285mg
17%
Protein
4.8g
12.48g
15%
Vitamin B6
0.13mg
0.318mg
14%
Calories
105kcal
354kcal
12%
Zinc
1.4mg
2.77mg
12%
Vitamin B5
0.282mg
6%
Choline
30.8mg
6%
Polyunsaturated fat
0.172g
1.108g
6%
Potassium
296mg
452mg
5%
Fats
0.4g
2.3g
3%
Vitamin C
3.1mg
0mg
3%
Vitamin E
0.15mg
0.57mg
3%
Calcium
50mg
33mg
2%
Saturated fat
0.103g
0.482g
2%
Vitamin K
0.8µg
2.2µg
1%
Folate
24µg
19µg
1%
Monounsaturated fat
0.035g
0.295g
1%
Protein per 100 calories
4.6g
3.5g
N/A
Calories per 10 g protein
219kcal
284kcal
N/A
Weight per 100 calories
95g
28g
N/A
Unsaturated / Saturated Fat ratio
2
2.9
N/A
Net carbs
14.99g
56.18g
N/A
Sugar
7.78g
0.8g
N/A
Sodium
1mg
12mg
0%
Vitamin A
5µg
1µg
0%
Tryptophan
0.208mg
0%
Threonine
0.424mg
0%
Isoleucine
0.456mg
0%
Leucine
0.848mg
0%
Lysine
0.465mg
0%
Methionine
0.24mg
0%
Phenylalanine
0.7mg
0%
Valine
0.612mg
0%
Histidine
0.281mg
0%
Macronutrient Comparison
Macronutrient breakdown side-by-side comparison
1
5%
20%
73%
2%
Protein:
4.8 g
Fats:
0.4 g
Carbs:
20.49 g
Water:
72.6 g
Other:
1.71 g
4
12%
2%
73%
9%
2%
Protein:
12.48 g
Fats:
2.3 g
Carbs:
73.48 g
Water:
9.44 g
Other:
2.3 g
Contains
more
Water Water
+669.1%
Contains
more
Protein Protein
+160%
Contains
more
Fats Fats
+475%
Contains
more
Carbs Carbs
+258.6%
Contains
more
Other Other
+34.5%
Fat Type Comparison
Fat type breakdown side-by-side comparison
1
33%
11%
55%
Saturated fat:
Sat. Fat
0.103 g
Monounsaturated fat:
Mono. Fat
0.035 g
Polyunsaturated fat:
Poly. Fat
0.172 g
2
26%
16%
59%
Saturated fat:
Sat. Fat
0.482 g
Monounsaturated fat:
Mono. Fat
0.295 g
Polyunsaturated fat:
Poly. Fat
1.108 g
Contains
less
Sat. Fat Saturated fat
-78.6%
Contains
more
Mono. Fat Monounsaturated fat
+742.9%
Contains
more
Poly. Fat Polyunsaturated fat
+544.2%