
Beef, variety meats and by-products, mechanically separated beef, raw vs. Chicken gizzard raw — In-Depth Nutrition Comparison
Compare
Summary of differences between beef, variety meats and by-products, mechanically separated beef, raw and chicken gizzard raw
- Beef, variety meats, and by-products, mechanically separated beef, raw has more vitamin B12, calcium, iron, fats, phosphorus, and vitamin B6, while chicken gizzard raw has more selenium and vitamin B2.
- Beef, variety meats, and by-products, mechanically separated beef, raw covers your daily need for saturated fat 56% more than chicken gizzard raw.
- Beef, variety meats, and by-products, mechanically separated beef, raw contains 44 times more calcium than chicken gizzard raw. While beef, variety meats, and by-products, mechanically separated beef, raw contains 485mg of calcium, chicken gizzard raw contains only 11mg.
- The amount of saturated fat in chicken gizzard raw is lower.
These are the specific foods used in this comparison Beef, variety meats, and by-products, mechanically separated beef, raw and Chicken, gizzard, all classes, raw.
Infographic
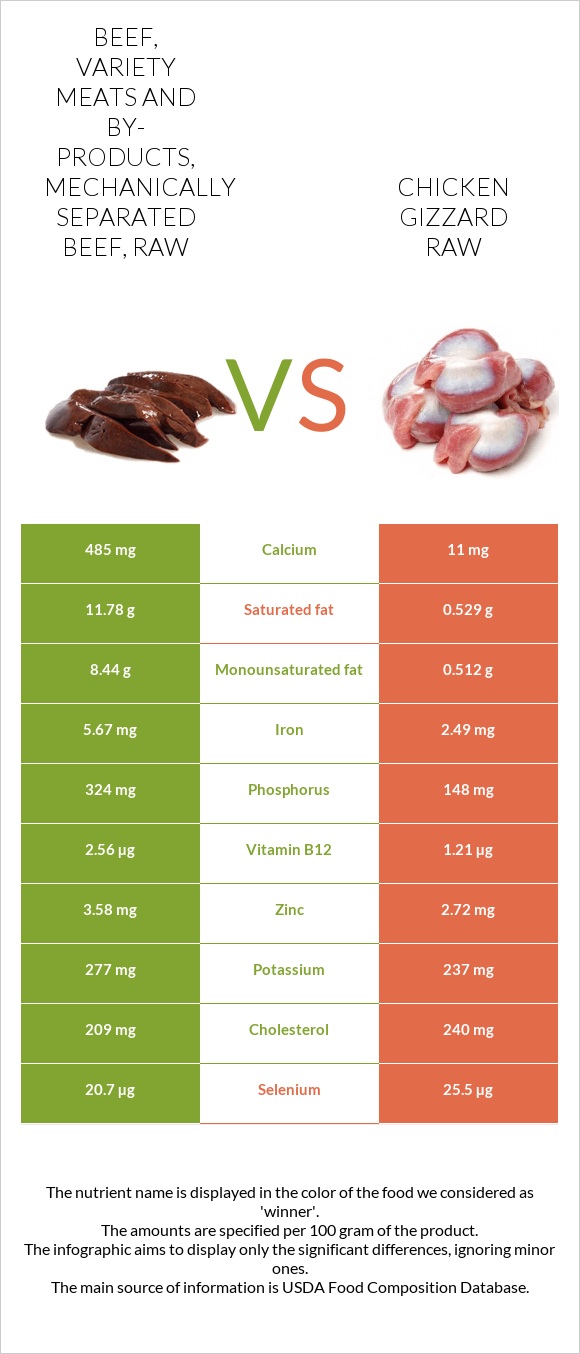
Infographic link
Mineral Comparison
The mineral comparison score is based on which food has a more favorable amount of each mineral. The �coverage� charts below show how much of the daily mineral needs are covered by the selected amount of each food.
| Contains more MagnesiumMagnesium | +13.3% |
| Contains more CalciumCalcium | +4309.1% |
| Contains more PotassiumPotassium | +16.9% |
| Contains more IronIron | +127.7% |
| Contains more ZincZinc | +31.6% |
| Contains more PhosphorusPhosphorus | +118.9% |
| Contains less SodiumSodium | -17.4% |
| Contains more CopperCopper | +107.1% |
| Contains more ManganeseManganese | +358.3% |
| Contains more SeleniumSelenium | +23.2% |
Vitamin Comparison
The vitamin comparison score is based on the number of vitamins in which one food is richer than the other. The �coverage� charts below show how much of the daily vitamin needs are covered by the selected amount of each food.
| Contains more Vitamin B1Vitamin B1 | +157.1% |
| Contains more Vitamin B6Vitamin B6 | +158.9% |
| Contains more Vitamin B12Vitamin B12 | +111.6% |
| Contains more Vitamin CVitamin C | +∞% |
| Contains more Vitamin AVitamin A | +∞% |
| Contains more Vitamin EVitamin E | +∞% |
| Contains more Vitamin B2Vitamin B2 | +95.8% |
| Contains more Vitamin B3Vitamin B3 | +44.5% |
| Contains more Vitamin B5Vitamin B5 | +126.2% |
All nutrients comparison - raw data values
| Nutrient |  |
 |
DV% diff. |
| Vitamin B12 | 2.56µg | 1.21µg | 56% |
| Saturated fat | 11.78g | 0.529g | 51% |
| Calcium | 485mg | 11mg | 47% |
| Iron | 5.67mg | 2.49mg | 40% |
| Fats | 23.52g | 2.06g | 33% |
| Phosphorus | 324mg | 148mg | 25% |
| Monounsaturated fat | 8.44g | 0.512g | 20% |
| Vitamin B6 | 0.29mg | 0.112mg | 14% |
| Cholesterol | 209mg | 240mg | 10% |
| Calories | 276kcal | 94kcal | 9% |
| Selenium | 20.7µg | 25.5µg | 9% |
| Vitamin B2 | 0.118mg | 0.231mg | 9% |
| Zinc | 3.58mg | 2.72mg | 8% |
| Copper | 0.056mg | 0.116mg | 7% |
| Vitamin B3 | 2.546mg | 3.68mg | 7% |
| Vitamin B5 | 0.279mg | 0.631mg | 7% |
| Protein | 14.97g | 17.66g | 5% |
| Vitamin C | 0mg | 3.7mg | 4% |
| Vitamin B1 | 0.072mg | 0.028mg | 4% |
| Polyunsaturated fat | 0.76g | 0.357g | 3% |
| Vitamin A | 0µg | 19µg | 2% |
| Vitamin E | 0.33mg | 2% | |
| Manganese | 0.012mg | 0.055mg | 2% |
| Potassium | 277mg | 237mg | 1% |
| Sodium | 57mg | 69mg | 1% |
| Omega-3 (ALA) | 0.009g | 1% | |
| Protein per 100 calories | 5.4g | 19g | N/A |
| Calories per 10 g protein | 184kcal | 53kcal | N/A |
| Weight per 100 calories | 36g | 106g | N/A |
| Unsaturated / Saturated Fat ratio | 0.78 | 1.6 | N/A |
| Magnesium | 17mg | 15mg | 0% |
| Folate | 5µg | 5µg | 0% |
| Trans fat | 0.06g | N/A | |
| Tryptophan | 0.168mg | 0% | |
| Threonine | 0.474mg | 0% | |
| Isoleucine | 0.584mg | 0% | |
| Leucine | 1.199mg | 0% | |
| Lysine | 1.161mg | 0% | |
| Methionine | 0.426mg | 0% | |
| Phenylalanine | 0.644mg | 0% | |
| Valine | 0.915mg | 0% | |
| Histidine | 0.443mg | 0% | |
| Omega-6 (Gamma-linolenic acid) | 0.003g | N/A | |
| Omega-6 (Eicosadienoic acid) | 0.013g | N/A |
Macronutrient Comparison
Macronutrient breakdown side-by-side comparison
Protein:
14.97 g
Fats:
23.52 g
Carbs:
0 g
Water:
59.39 g
Other:
2.12 g
Protein:
17.66 g
Fats:
2.06 g
Carbs:
0 g
Water:
79.33 g
Other:
0.95 g
| Contains more FatsFats | +1041.7% |
| Contains more ProteinProtein | +18% |
| Contains more WaterWater | +33.6% |
~equal in
Carbs
~0g
Fat Type Comparison
Fat type breakdown side-by-side comparison
Saturated fat:
Sat. Fat
11.78 g
Monounsaturated fat:
Mono. Fat
8.44 g
Polyunsaturated fat:
Poly. Fat
0.76 g
Saturated fat:
Sat. Fat
0.529 g
Monounsaturated fat:
Mono. Fat
0.512 g
Polyunsaturated fat:
Poly. Fat
0.357 g
| Contains more Mono. FatMonounsaturated fat | +1548.4% |
| Contains more Poly. FatPolyunsaturated fat | +112.9% |
| Contains less Sat. FatSaturated fat | -95.5% |