
Beverages, Energy Drink with carbonated water and high fructose corn syrup vs. Coca-Cola — In-Depth Nutrition Comparison
Compare
Significant differences between beverages, Energy Drink with carbonated water and high fructose corn syrup and Coca-Cola
- Beverages, Energy Drink with carbonated water and high fructose corn syrup is richer than Coca-Cola in vitamin B12, vitamin B6, folate, vitamin C, selenium, and zinc.
- Beverages, Energy Drink with carbonated water and high fructose corn syrup covers your daily vitamin B12 needs 104% more than Coca-Cola.
- Coca-Cola is lower in sugar.
Specific food types used in this comparison are Beverages, Energy Drink with carbonated water and high fructose corn syrup and Beverages, carbonated, cola, fast-food cola.
Infographic
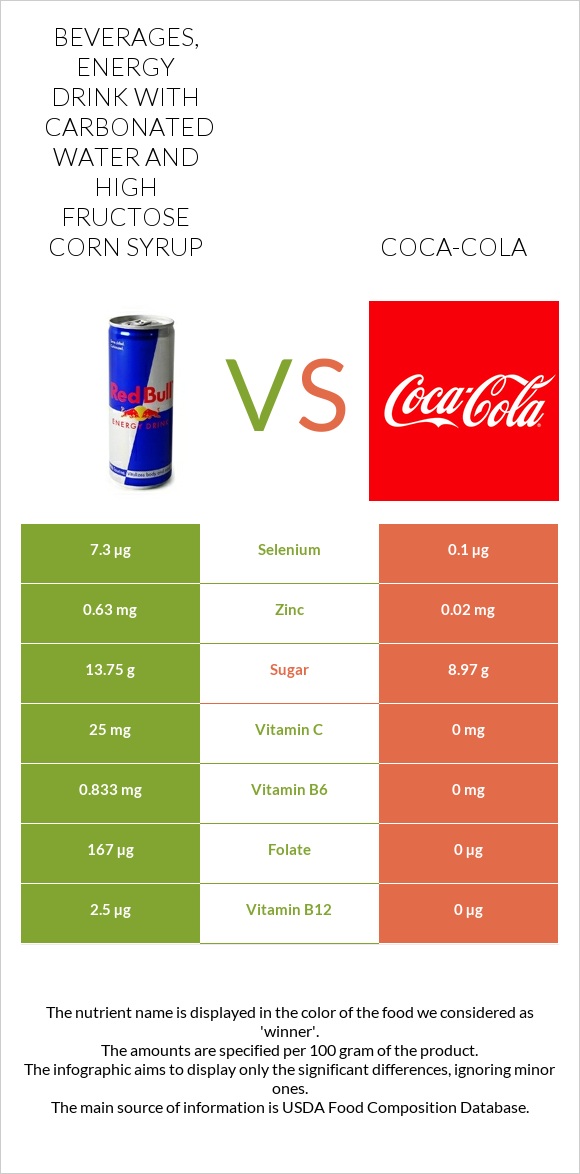
Infographic link
Mineral Comparison
The mineral comparison score is based on which food has a more favorable amount of each mineral. The �coverage� charts below show how much of the daily mineral needs are covered by the selected amount of each food.
| Contains more PotassiumPotassium | +400% |
| Contains more ZincZinc | +3050% |
| Contains more SeleniumSelenium | +7200% |
| Contains more CalciumCalcium | +∞% |
| Contains more IronIron | +∞% |
| Contains more CopperCopper | +∞% |
| Contains more PhosphorusPhosphorus | +∞% |
| Contains less SodiumSodium | -91.7% |
| Contains more ManganeseManganese | +∞% |
Vitamin Comparison
The vitamin comparison score is based on the number of vitamins in which one food is richer than the other. The �coverage� charts below show how much of the daily vitamin needs are covered by the selected amount of each food.
| Contains more Vitamin CVitamin C | +∞% |
| Contains more Vitamin B6Vitamin B6 | +∞% |
| Contains more Vitamin B12Vitamin B12 | +∞% |
| Contains more FolateFolate | +∞% |
All nutrients comparison - raw data values
| Nutrient |  |
 |
DV% diff. |
| Vitamin B12 | 2.5µg | 0µg | 104% |
| Vitamin B6 | 0.833mg | 0mg | 64% |
| Folate | 167µg | 0µg | 42% |
| Vitamin C | 25mg | 0mg | 28% |
| Selenium | 7.3µg | 0.1µg | 13% |
| Caffeine | 38mg | 8mg | 8% |
| Zinc | 0.63mg | 0.02mg | 6% |
| Carbs | 15g | 9.56g | 2% |
| Sodium | 48mg | 4mg | 2% |
| Calories | 62kcal | 37kcal | 1% |
| Protein | 0.42g | 0.07g | 1% |
| Iron | 0mg | 0.11mg | 1% |
| Phosphorus | 0mg | 10mg | 1% |
| Weight per 100 calories | 161g | 270g | N/A |
| Fats | 0g | 0.02g | 0% |
| Net carbs | 15g | 9.56g | N/A |
| Calcium | 0mg | 2mg | 0% |
| Potassium | 10mg | 2mg | 0% |
| Sugar | 13.75g | 8.97g | N/A |
| Copper | 0mg | 0.001mg | 0% |
| Manganese | 0.002mg | 0% | |
| Choline | 0mg | 0.3mg | 0% |
Macronutrient Comparison
Macronutrient breakdown side-by-side comparison
Protein:
0.42 g
Fats:
0 g
Carbs:
15 g
Water:
84.52 g
Other:
0.06 g
Protein:
0.07 g
Fats:
0.02 g
Carbs:
9.56 g
Water:
90.31 g
Other:
0.04 g
| Contains more ProteinProtein | +500% |
| Contains more CarbsCarbs | +56.9% |
| Contains more FatsFats | +∞% |
~equal in
Water
~90.31g