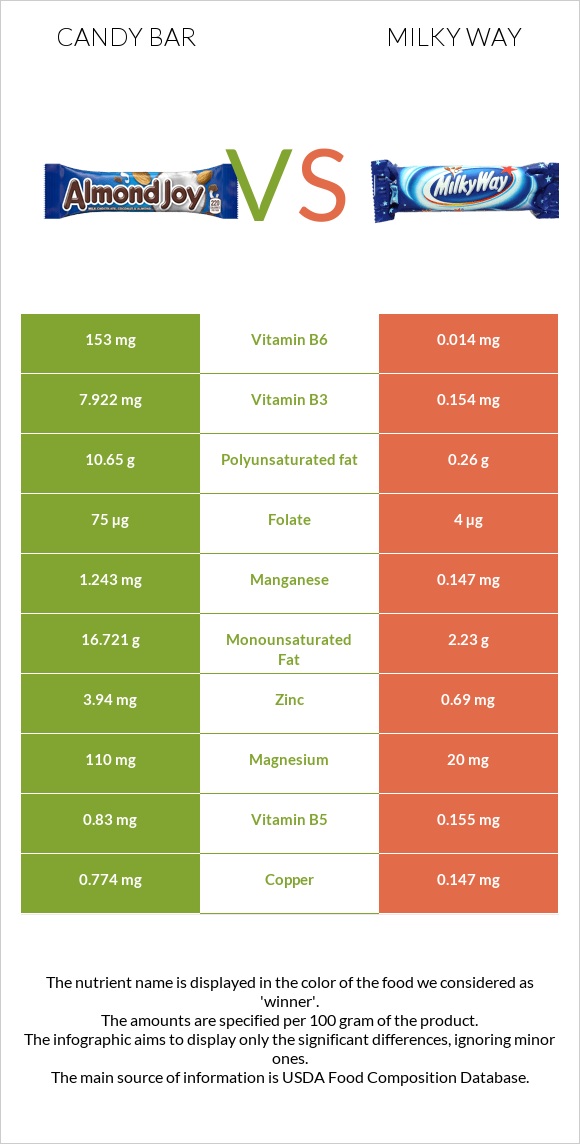
Important differences between candy bar and Milky Way Milky Way has less vitamin B6, copper, vitamin B3, manganese, phosphorus, zinc, magnesium, vitamin E, and folate. Candy bar's daily need coverage for vitamin B6 is 11768% more. Candy bar has 51 times more vitamin B3 than Milky Way. Candy bar has 7.922mg of vitamin B3, while Milky Way has 0.154mg. Candy bar is lower in saturated fat. Milky Way has a higher glycemic index than candy bar. The food varieties used in the comparison are Candies, peanut bar and Candies, MARS SNACKFOOD US, MILKY WAY Bar .
Infographic
Mineral Comparison
Mineral comparison score is based on the number of minerals by which one or the other food is richer. The "coverage" charts below show how much of the daily needs can be covered by 300 grams of the food.
8
100 g
300 g
1 oz - 28.35g 1 bar (1.4 oz) - 40g 1 bar (1.6 oz) - 45g 1 bar (1.75 fl oz) - 50g
Magnesium
Magnesium
Calcium
Calcium
Potassium
Potassium
Iron
Iron
Copper
Copper
Zinc
Zinc
Phosphorus
Phosphorus
Sodium
Sodium
Manganese
Manganese
Selenium
Selenium
79%
23%
36%
36%
258%
107%
132%
20%
162%
26%
1
100 g
300 g
1 piece miniature 5 pieces = serving - 8.2g 1 bar fun size - 17g 1 serving 2.05 oz bar - 58g 1 bar king size - 103g
Magnesium
Magnesium
Calcium
Calcium
Potassium
Potassium
Iron
Iron
Copper
Copper
Zinc
Zinc
Phosphorus
Phosphorus
Sodium
Sodium
Manganese
Manganese
Selenium
Selenium
14%
35%
11%
18%
49%
19%
29%
22%
19%
11%
Vitamin Comparison
Vitamin comparison score is based on the number of vitamins by which one or the other food is richer. The "coverage" charts below show how much of the daily needs can be covered by 300 grams of the food.
7
100 g
300 g
1 oz - 28.35g 1 bar (1.4 oz) - 40g 1 bar (1.6 oz) - 45g 1 bar (1.75 fl oz) - 50g
Vitamin C
Vit. C
Vitamin D
Vit. D
Vitamin A
Vit. A
Vitamin E
Vit. E
Vitamin B1
Vit. B1
Vitamin B2
Vit. B2
Vitamin B3
Vit. B3
Vitamin B5
Vit. B5
Vitamin B6
Vit. B6
Vitamin B12
Vit. B12
Vitamin K
Vit. K
Folate
Folate
0%
0%
0%
82%
25%
32%
149%
50%
35308%
0%
0%
56%
5
100 g
300 g
1 piece miniature 5 pieces = serving - 8.2g 1 bar fun size - 17g 1 serving 2.05 oz bar - 58g 1 bar king size - 103g
Vitamin C
Vit. C
Vitamin D
Vit. D
Vitamin A
Vit. A
Vitamin E
Vit. E
Vitamin B1
Vit. B1
Vitamin B2
Vit. B2
Vitamin B3
Vit. B3
Vitamin B5
Vit. B5
Vitamin B6
Vit. B6
Vitamin B12
Vit. B12
Vitamin K
Vit. K
Folate
Folate
2.3%
6%
10%
18%
12%
24%
2.9%
9.3%
3.2%
23%
9%
3%
All nutrients comparison - raw data values
Nutrient
DV% diff.
Vitamin B6
153mg
0.014mg
11768%
Copper
0.774mg
0.147mg
70%
Polyunsaturated fat
10.65g
0.26g
69%
Vitamin B3
7.922mg
0.154mg
49%
Manganese
1.243mg
0.147mg
48%
Monounsaturated fat
16.721g
2.23g
36%
Phosphorus
308mg
67mg
34%
Saturated fat
4.678g
12.016g
33%
Zinc
3.94mg
0.69mg
30%
Fats
33.7g
17.23g
25%
Protein
15.5g
4.01g
23%
Magnesium
110mg
20mg
21%
Vitamin E
4.1mg
0.89mg
21%
Folate
75µg
4µg
18%
Vitamin B5
0.83mg
0.155mg
14%
Fiber
4.1g
1g
12%
Carbs
47.4g
71.17g
8%
Potassium
407mg
124mg
8%
Vitamin B12
0µg
0.18µg
8%
Iron
0.97mg
0.49mg
6%
Selenium
4.7µg
2µg
5%
Vitamin B1
0.1mg
0.046mg
5%
Calcium
78mg
115mg
4%
Calories
522kcal
456kcal
3%
Cholesterol
0mg
9mg
3%
Vitamin A
0µg
31µg
3%
Vitamin B2
0.14mg
0.103mg
3%
Vitamin K
0µg
3.6µg
3%
Vitamin D*
0 IU
16 IU
2%
Vitamin D
0µg
0.4µg
2%
Choline
29.4mg
16.5mg
2%
Caffeine
0mg
6mg
2%
Vitamin C
0mg
0.7mg
1%
Protein per 100 calories
3g
0.88g
N/A
Calories per 10 g protein
337kcal
1137kcal
N/A
Weight per 100 calories
19g
22g
N/A
Unsaturated / Saturated Fat ratio
5.9
0.21
N/A
Net carbs
43.3g
70.17g
N/A
Sugar
42.22g
59.69g
N/A
Sodium
156mg
167mg
0%
Trans fat
0.206g
N/A
Tryptophan
0.149mg
0%
Threonine
0.52mg
0%
Isoleucine
0.534mg
0%
Leucine
0.986mg
0%
Lysine
0.545mg
0%
Methionine
0.185mg
0%
Phenylalanine
0.787mg
0%
Valine
0.638mg
0%
Histidine
0.385mg
0%
Macronutrient Comparison
Macronutrient breakdown side-by-side comparison
3
16%
34%
47%
2%
Protein:
15.5 g
Fats:
33.7 g
Carbs:
47.4 g
Water:
1.6 g
Other:
1.8 g
2
4%
17%
71%
6%
Protein:
4.01 g
Fats:
17.23 g
Carbs:
71.17 g
Water:
6.3 g
Other:
1.29 g
Contains
more
Protein Protein
+286.5%
Contains
more
Fats Fats
+95.6%
Contains
more
Other Other
+39.5%
Contains
more
Carbs Carbs
+50.1%
Contains
more
Water Water
+293.8%
Fat Type Comparison
Fat type breakdown side-by-side comparison
3
15%
52%
33%
Saturated fat:
Sat. Fat
4.678 g
Monounsaturated fat:
Mono. Fat
16.721 g
Polyunsaturated fat:
Poly. Fat
10.65 g
0
83%
15%
2%
Saturated fat:
Sat. Fat
12.016 g
Monounsaturated fat:
Mono. Fat
2.23 g
Polyunsaturated fat:
Poly. Fat
0.26 g
Contains
less
Sat. Fat Saturated fat
-61.1%
Contains
more
Mono. Fat Monounsaturated fat
+649.8%
Contains
more
Poly. Fat Polyunsaturated fat
+3996.2%