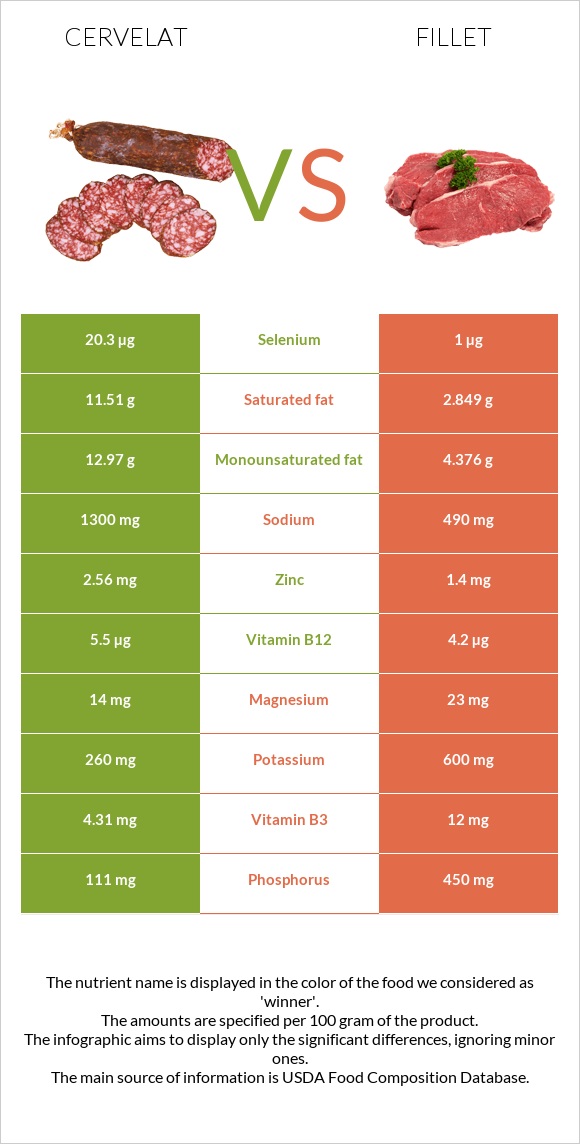
Important differences between cervelat and fillet Cervelat has more vitamin B12 and selenium; however, fillet has more vitamin B6, copper, vitamin B1, phosphorus, vitamin B3, and vitamin B2. Fillet's daily need coverage for vitamin B6 is 95% more. Cervelat has 20 times more selenium than fillet. Cervelat has 20.3µg of selenium, while fillet has 1µg. Fillet is lower in saturated fat. Cervelat has a higher glycemic index than fillet. The food varieties used in the comparison are Thuringer, cervelat, summer sausage, beef, pork and Vegetarian fillets .
Infographic
Mineral Comparison
Mineral comparison score is based on the number of minerals by which one or the other food is richer. The "coverage" charts below show how much of the daily needs can be covered by 300 grams of the food.
2
100 g
300 g
2 oz 1 serving - 56g
Magnesium
Magnesium
Calcium
Calcium
Potassium
Potassium
Iron
Iron
Copper
Copper
Zinc
Zinc
Phosphorus
Phosphorus
Sodium
Sodium
Manganese
Manganese
Selenium
Selenium
10%
2.7%
23%
77%
50%
70%
48%
170%
0%
111%
6
100 g
300 g
1 fillet - 85g
Magnesium
Magnesium
Calcium
Calcium
Potassium
Potassium
Iron
Iron
Copper
Copper
Zinc
Zinc
Phosphorus
Phosphorus
Sodium
Sodium
Manganese
Manganese
Selenium
Selenium
16%
29%
53%
75%
308%
38%
193%
64%
0%
5.5%
Vitamin Comparison
Vitamin comparison score is based on the number of vitamins by which one or the other food is richer. The "coverage" charts below show how much of the daily needs can be covered by 300 grams of the food.
4
100 g
300 g
2 oz 1 serving - 56g
Vitamin C
Vit. C
Vitamin D
Vit. D
Vitamin A
Vit. A
Vitamin E
Vit. E
Vitamin B1
Vit. B1
Vitamin B2
Vit. B2
Vitamin B3
Vit. B3
Vitamin B5
Vit. B5
Vitamin B6
Vit. B6
Vitamin B12
Vit. B12
Vitamin K
Vit. K
Folate
Folate
55%
17%
0%
4.4%
38%
76%
81%
0%
60%
688%
3.3%
1.5%
6
100 g
300 g
1 fillet - 85g
Vitamin C
Vit. C
Vitamin D
Vit. D
Vitamin A
Vit. A
Vitamin E
Vit. E
Vitamin B1
Vit. B1
Vitamin B2
Vit. B2
Vitamin B3
Vit. B3
Vitamin B5
Vit. B5
Vitamin B6
Vit. B6
Vitamin B12
Vit. B12
Vitamin K
Vit. K
Folate
Folate
0%
0%
0%
69%
275%
208%
225%
0%
346%
525%
0%
77%
All nutrients comparison - raw data values
Nutrient
DV% diff.
Vitamin B6
0.26mg
1.5mg
95%
Copper
0.15mg
0.925mg
86%
Vitamin B1
0.15mg
1.1mg
79%
Vitamin B12
5.5µg
4.2µg
54%
Polyunsaturated fat
1.2g
9.332g
54%
Phosphorus
111mg
450mg
48%
Vitamin B3
4.31mg
12mg
48%
Vitamin B2
0.33mg
0.9mg
44%
Saturated fat
11.51g
2.849g
39%
Sodium
1300mg
490mg
35%
Selenium
20.3µg
1µg
35%
Cholesterol
74mg
0mg
25%
Folate
2µg
102µg
25%
Fiber
0g
6.1g
24%
Vitamin E
0.22mg
3.45mg
22%
Monounsaturated fat
12.97g
4.376g
21%
Fats
30.43g
18g
19%
Vitamin C
16.6mg
0mg
18%
Protein
17.45g
23g
11%
Zinc
2.56mg
1.4mg
11%
Potassium
260mg
600mg
10%
Calcium
9mg
95mg
9%
Vitamin D*
44 IU
0 IU
6%
Vitamin D
1.1µg
0µg
6%
Calories
362kcal
290kcal
4%
Carbs
3.33g
9g
2%
Magnesium
14mg
23mg
2%
Iron
2.04mg
2mg
1%
Vitamin K
1.3µg
0µg
1%
Choline
78.9mg
82mg
1%
Protein per 100 calories
4.8g
7.9g
N/A
Calories per 10 g protein
207kcal
126kcal
N/A
Weight per 100 calories
28g
34g
N/A
Unsaturated / Saturated Fat ratio
1.2
4.8
N/A
Net carbs
3.33g
2.9g
N/A
Sugar
0.85g
0.8g
N/A
Macronutrient Comparison
Macronutrient breakdown side-by-side comparison
2
17%
30%
3%
45%
4%
Protein:
17.45 g
Fats:
30.43 g
Carbs:
3.33 g
Water:
45.18 g
Other:
3.61 g
3
23%
18%
9%
45%
5%
Protein:
23 g
Fats:
18 g
Carbs:
9 g
Water:
45 g
Other:
5 g
Contains
more
Fats Fats
+69.1%
Contains
more
Protein Protein
+31.8%
Contains
more
Carbs Carbs
+170.3%
Contains
more
Other Other
+38.5%
Fat Type Comparison
Fat type breakdown side-by-side comparison
1
45%
51%
5%
Saturated fat:
Sat. Fat
11.51 g
Monounsaturated fat:
Mono. Fat
12.97 g
Polyunsaturated fat:
Poly. Fat
1.2 g
2
17%
26%
56%
Saturated fat:
Sat. Fat
2.849 g
Monounsaturated fat:
Mono. Fat
4.376 g
Polyunsaturated fat:
Poly. Fat
9.332 g
Contains
more
Mono. Fat Monounsaturated fat
+196.4%
Contains
less
Sat. Fat Saturated fat
-75.2%
Contains
more
Poly. Fat Polyunsaturated fat
+677.7%