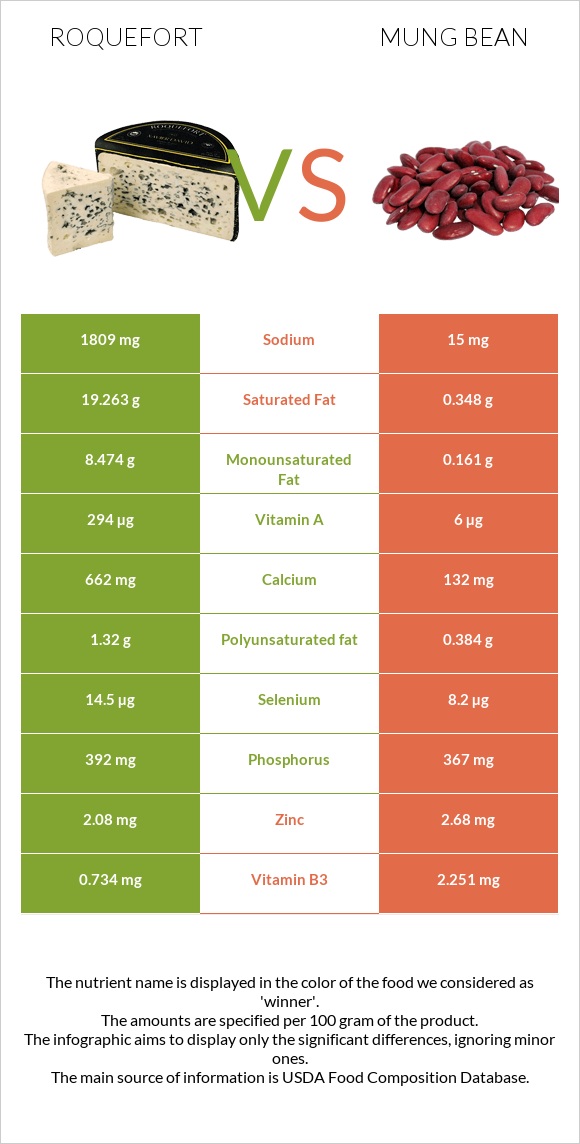
How are roquefort and mung beans different? Roquefort is higher in calcium; however, mung beans are richer in folate, copper, iron, fiber, vitamin B1, manganese, and magnesium. Daily need coverage for folate for mung beans is 144% higher. Roquefort contains 121 times more sodium than mung beans. While roquefort contains 1809mg of sodium, mung beans contain only 15mg. Cheese, roquefort and Mung beans, mature seeds, raw are the varieties used in this article.
Infographic
Mineral Comparison
Mineral comparison score is based on the number of minerals by which one or the other food is richer. The "coverage" charts below show how much of the daily needs can be covered by 300 grams of the food.
2
100 g
300 g
1 oz - 28.35g 1 package (3 oz) - 85g
Magnesium
Magnesium
Calcium
Calcium
Potassium
Potassium
Iron
Iron
Copper
Copper
Zinc
Zinc
Phosphorus
Phosphorus
Sodium
Sodium
Manganese
Manganese
Selenium
Selenium
21%
199%
8%
21%
11%
57%
168%
236%
3.9%
79%
7
100 g
300 g
1 tbsp - 13g 1 cup - 207g
Magnesium
Magnesium
Calcium
Calcium
Potassium
Potassium
Iron
Iron
Copper
Copper
Zinc
Zinc
Phosphorus
Phosphorus
Sodium
Sodium
Manganese
Manganese
Selenium
Selenium
135%
40%
110%
253%
314%
73%
157%
2%
135%
45%
Vitamin Comparison
Vitamin comparison score is based on the number of vitamins by which one or the other food is richer. The "coverage" charts below show how much of the daily needs can be covered by 300 grams of the food.
3
100 g
300 g
1 oz - 28.35g 1 package (3 oz) - 85g
Vitamin C
Vit. C
Vitamin D
Vit. D
Vitamin A
Vit. A
Vitamin E
Vit. E
Vitamin B1
Vit. B1
Vitamin B2
Vit. B2
Vitamin B3
Vit. B3
Vitamin B5
Vit. B5
Vitamin B6
Vit. B6
Vitamin B12
Vit. B12
Vitamin K
Vit. K
Folate
Folate
0%
0%
98%
0%
10%
135%
14%
104%
29%
80%
0%
37%
8
100 g
300 g
1 tbsp - 13g 1 cup - 207g
Vitamin C
Vit. C
Vitamin D
Vit. D
Vitamin A
Vit. A
Vitamin E
Vit. E
Vitamin B1
Vit. B1
Vitamin B2
Vit. B2
Vitamin B3
Vit. B3
Vitamin B5
Vit. B5
Vitamin B6
Vit. B6
Vitamin B12
Vit. B12
Vitamin K
Vit. K
Folate
Folate
16%
0%
2%
10%
155%
54%
42%
115%
88%
0%
23%
469%
All nutrients comparison - raw data values
Nutrient
DV% diff.
Folate
49µg
625µg
144%
Copper
0.034mg
0.941mg
101%
Saturated fat
19.263g
0.348g
86%
Sodium
1809mg
15mg
78%
Iron
0.56mg
6.74mg
77%
Fiber
0g
16.3g
65%
Calcium
662mg
132mg
53%
Vitamin B1
0.04mg
0.621mg
48%
Fats
30.64g
1.15g
45%
Manganese
0.03mg
1.035mg
44%
Magnesium
30mg
189mg
38%
Potassium
91mg
1246mg
34%
Vitamin A
294µg
6µg
32%
Cholesterol
90mg
0mg
30%
Vitamin B2
0.586mg
0.233mg
27%
Vitamin B12
0.64µg
0µg
27%
Monounsaturated fat
8.474g
0.161g
21%
Carbs
2g
62.62g
20%
Vitamin B6
0.124mg
0.382mg
20%
Choline
97.9mg
18%
Selenium
14.5µg
8.2µg
11%
Vitamin B3
0.734mg
2.251mg
9%
Vitamin K
9µg
8%
Polyunsaturated fat
1.32g
0.384g
6%
Protein
21.54g
23.86g
5%
Vitamin C
0mg
4.8mg
5%
Zinc
2.08mg
2.68mg
5%
Phosphorus
392mg
367mg
4%
Vitamin B5
1.731mg
1.91mg
4%
Vitamin E
0.51mg
3%
Calories
369kcal
347kcal
1%
Protein per 100 calories
5.8g
6.9g
N/A
Calories per 10 g protein
171kcal
145kcal
N/A
Weight per 100 calories
27g
29g
N/A
Unsaturated / Saturated Fat ratio
0.51
1.6
N/A
Net carbs
2g
46.32g
N/A
Sugar
6.6g
N/A
Tryptophan
0.303mg
0.26mg
0%
Threonine
0.965mg
0.782mg
0%
Isoleucine
1.217mg
1.008mg
0%
Leucine
2.114mg
1.847mg
0%
Lysine
1.848mg
1.664mg
0%
Methionine
0.558mg
0.286mg
0%
Phenylalanine
1.023mg
1.443mg
0%
Valine
1.614mg
1.237mg
0%
Histidine
0.602mg
0.695mg
0%
Macronutrient Comparison
Macronutrient breakdown side-by-side comparison
3
22%
31%
2%
39%
6%
Protein:
21.54 g
Fats:
30.64 g
Carbs:
2 g
Water:
39.38 g
Other:
6.44 g
2
24%
63%
9%
3%
Protein:
23.86 g
Fats:
1.15 g
Carbs:
62.62 g
Water:
9.05 g
Other:
3.32 g
Contains
more
Fats Fats
+2564.3%
Contains
more
Water Water
+335.1%
Contains
more
Other Other
+94%
Contains
more
Protein Protein
+10.8%
Contains
more
Carbs Carbs
+3031%
Fat Type Comparison
Fat type breakdown side-by-side comparison
2
66%
29%
5%
Saturated fat:
Sat. Fat
19.263 g
Monounsaturated fat:
Mono. Fat
8.474 g
Polyunsaturated fat:
Poly. Fat
1.32 g
1
39%
18%
43%
Saturated fat:
Sat. Fat
0.348 g
Monounsaturated fat:
Mono. Fat
0.161 g
Polyunsaturated fat:
Poly. Fat
0.384 g
Contains
more
Mono. Fat Monounsaturated fat
+5163.4%
Contains
more
Poly. Fat Polyunsaturated fat
+243.8%
Contains
less
Sat. Fat Saturated fat
-98.2%