Significant differences between roquefort and shrimp Roquefort has more calcium, phosphorus, and polyunsaturated fat; however, shrimp is richer in copper. Roquefort covers your daily saturated fat needs 96% more than shrimp. Shrimp has 17 times less polyunsaturated fat than roquefort. Roquefort has 1.32g of polyunsaturated fat, while shrimp has 0.079g. Shrimp contains less saturated fat. Shrimp has a higher glycemic index. The glycemic index of shrimp is 50, while the glycemic index of roquefort is 27. Specific food types used in this comparison are Cheese, roquefort and Crustaceans, shrimp, cooked (not previously frozen) .
Infographic
Mineral Comparison
Mineral comparison score is based on the number of minerals by which one or the other food is richer. The "coverage" charts below show how much of the daily needs can be covered by 300 grams of the food.
4
100 g
300 g
1 oz - 28.35g 1 package (3 oz) - 85g
Magnesium
Magnesium
Calcium
Calcium
Potassium
Potassium
Iron
Iron
Copper
Copper
Zinc
Zinc
Phosphorus
Phosphorus
Sodium
Sodium
Manganese
Manganese
Selenium
Selenium
21%
199%
8%
21%
11%
57%
168%
236%
3.9%
79%
4
100 g
300 g
3 oz - 85g
Magnesium
Magnesium
Calcium
Calcium
Potassium
Potassium
Iron
Iron
Copper
Copper
Zinc
Zinc
Phosphorus
Phosphorus
Sodium
Sodium
Manganese
Manganese
Selenium
Selenium
28%
21%
23%
19%
126%
45%
102%
14%
4.3%
0%
Vitamin Comparison
Vitamin comparison score is based on the number of vitamins by which one or the other food is richer. The "coverage" charts below show how much of the daily needs can be covered by 300 grams of the food.
8
100 g
300 g
1 oz - 28.35g 1 package (3 oz) - 85g
Vitamin C
Vit. C
Vitamin D
Vit. D
Vitamin A
Vit. A
Vitamin E
Vit. E
Vitamin B1
Vit. B1
Vitamin B2
Vit. B2
Vitamin B3
Vit. B3
Vitamin B5
Vit. B5
Vitamin B6
Vit. B6
Vitamin B12
Vit. B12
Vitamin K
Vit. K
Folate
Folate
0%
0%
98%
0%
10%
135%
14%
104%
29%
80%
0%
37%
0
100 g
300 g
3 oz - 85g
Vitamin C
Vit. C
Vitamin D
Vit. D
Vitamin A
Vit. A
Vitamin E
Vit. E
Vitamin B1
Vit. B1
Vitamin B2
Vit. B2
Vitamin B3
Vit. B3
Vitamin B5
Vit. B5
Vitamin B6
Vit. B6
Vitamin B12
Vit. B12
Vitamin K
Vit. K
Folate
Folate
0%
0%
0%
0%
0%
0%
0%
0%
0%
0%
0%
0%
All nutrients comparison - raw data values
Nutrient
DV% diff.
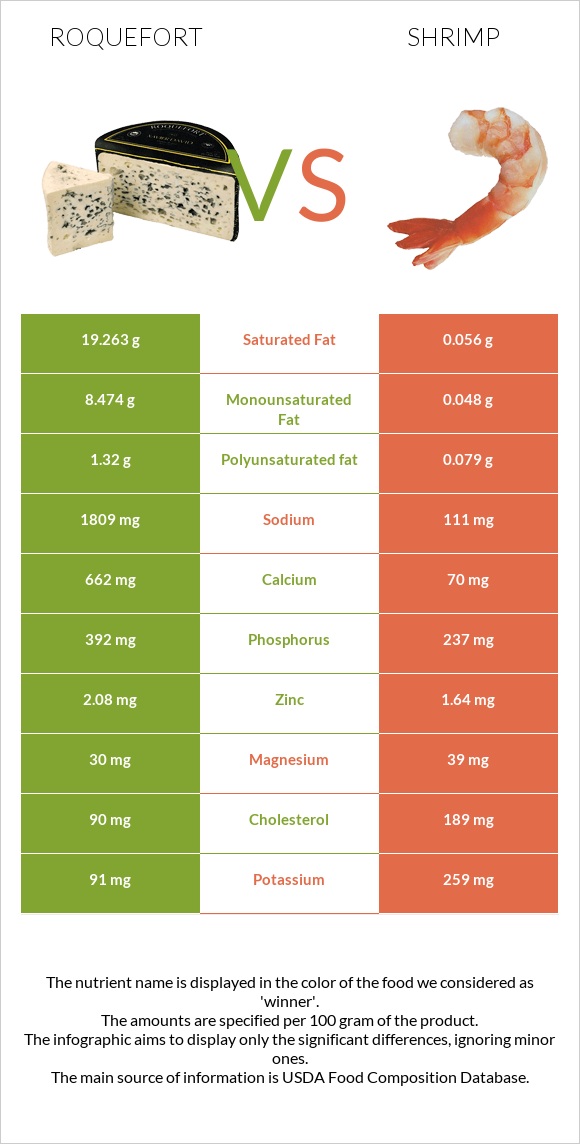
Saturated fat
19.263g
0.056g
87%
Sodium
1809mg
111mg
74%
Calcium
662mg
70mg
59%
Fats
30.64g
0.28g
47%
Vitamin B2
0.586mg
45%
Copper
0.034mg
0.379mg
38%
Vitamin B5
1.731mg
35%
Cholesterol
90mg
189mg
33%
Vitamin A
294µg
33%
Vitamin B12
0.64µg
27%
Selenium
14.5µg
26%
Phosphorus
392mg
237mg
22%
Monounsaturated fat
8.474g
0.048g
21%
Calories
369kcal
99kcal
14%
Folate
49µg
12%
Vitamin B6
0.124mg
10%
Polyunsaturated fat
1.32g
0.079g
8%
Protein
21.54g
23.98g
5%
Potassium
91mg
259mg
5%
Vitamin B3
0.734mg
5%
Zinc
2.08mg
1.64mg
4%
Vitamin B1
0.04mg
3%
Magnesium
30mg
39mg
2%
Carbs
2g
0.2g
1%
Iron
0.56mg
0.51mg
1%
Protein per 100 calories
5.8g
24g
N/A
Calories per 10 g protein
171kcal
41kcal
N/A
Weight per 100 calories
27g
101g
N/A
Unsaturated / Saturated Fat ratio
0.51
2.3
N/A
Net carbs
2g
0.2g
N/A
Manganese
0.03mg
0.033mg
0%
Trans fat
0.002g
N/A
Tryptophan
0.303mg
0%
Threonine
0.965mg
0%
Isoleucine
1.217mg
0%
Leucine
2.114mg
0%
Lysine
1.848mg
0%
Methionine
0.558mg
0%
Phenylalanine
1.023mg
0%
Valine
1.614mg
0%
Histidine
0.602mg
0%
Omega-3 - EPA
0.015g
N/A
Omega-3 - DHA
0.015g
N/A
Omega-3 - ALA
0.001g
N/A
Omega-3 - DPA
0.001g
N/A
Omega-6 - Dihomo-gamma-linoleic acid
0.001g
N/A
Omega-6 - Eicosadienoic acid
0.002g
N/A
Omega-6 - Linoleic acid
0.018g
N/A
Macronutrient Comparison
Macronutrient breakdown side-by-side comparison
3
22%
31%
2%
39%
6%
Protein:
21.54 g
Fats:
30.64 g
Carbs:
2 g
Water:
39.38 g
Other:
6.44 g
2
24%
74%
Protein:
23.98 g
Fats:
0.28 g
Carbs:
0.2 g
Water:
74.33 g
Other:
1.21 g
Contains
more
Fats Fats
+10842.9%
Contains
more
Carbs Carbs
+900%
Contains
more
Other Other
+432.2%
Contains
more
Protein Protein
+11.3%
Contains
more
Water Water
+88.8%
Fat Type Comparison
Fat type breakdown side-by-side comparison
2
66%
29%
5%
Saturated fat:
Sat. Fat
19.263 g
Monounsaturated fat:
Mono. Fat
8.474 g
Polyunsaturated fat:
Poly. Fat
1.32 g
1
31%
26%
43%
Saturated fat:
Sat. Fat
0.056 g
Monounsaturated fat:
Mono. Fat
0.048 g
Polyunsaturated fat:
Poly. Fat
0.079 g
Contains
more
Mono. Fat Monounsaturated fat
+17554.2%
Contains
more
Poly. Fat Polyunsaturated fat
+1570.9%
Contains
less
Sat. Fat Saturated fat
-99.7%