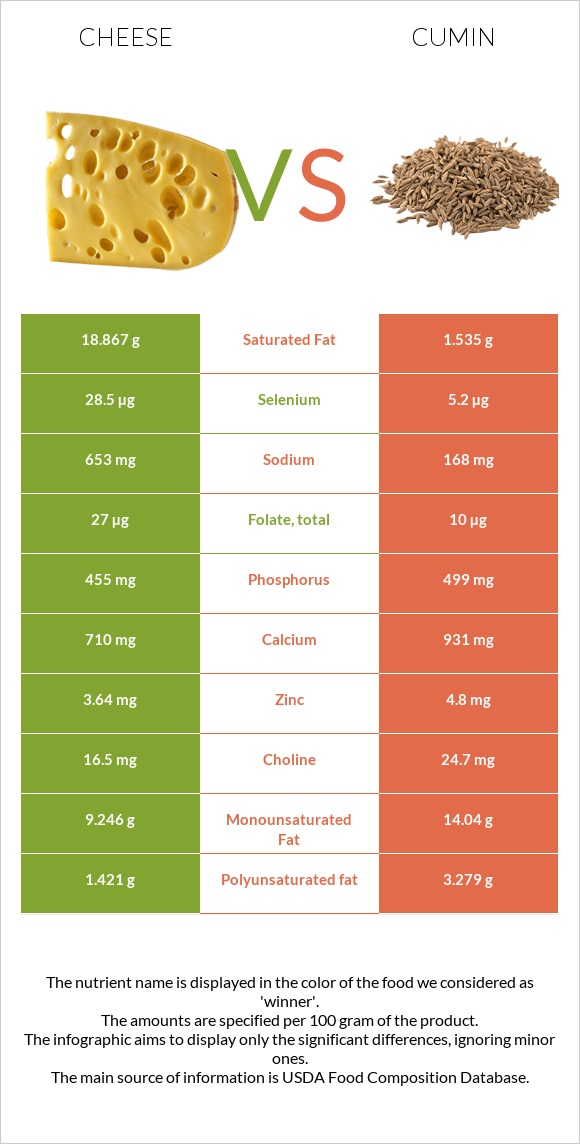
Summary of differences between cheese and cumin Cheese has more vitamin B12 and selenium; however, cumin is higher in iron, manganese, copper, magnesium, potassium, vitamin B1, and fiber. Cumin covers your daily need for iron, 828% more than cheese. Cumin has less saturated fat. These are the specific foods used in this comparison Cheese, cheddar and Spices, cumin seed .
Infographic
Mineral Comparison
Mineral comparison score is based on the number of minerals by which one or the other food is richer. The "coverage" charts below show how much of the daily needs can be covered by 300 grams of the food.
1
100 g
300 g
1 cubic inch - 17g 1 slice (1 oz) - 28g 1 oz - 28.35g 1 cup, shredded - 113g 1 cup, diced - 132g 1 cup, melted - 244g
Magnesium
Magnesium
Calcium
Calcium
Potassium
Potassium
Iron
Iron
Copper
Copper
Zinc
Zinc
Phosphorus
Phosphorus
Sodium
Sodium
Manganese
Manganese
Selenium
Selenium
19%
213%
6.7%
5.3%
10%
99%
195%
85%
3.5%
155%
8
100 g
300 g
0.25 tsp, whole - 0.5g 1 tbsp, whole - 6g
Magnesium
Magnesium
Calcium
Calcium
Potassium
Potassium
Iron
Iron
Copper
Copper
Zinc
Zinc
Phosphorus
Phosphorus
Sodium
Sodium
Manganese
Manganese
Selenium
Selenium
261%
279%
158%
2489%
289%
131%
214%
22%
435%
28%
Vitamin Comparison
Vitamin comparison score is based on the number of vitamins by which one or the other food is richer. The "coverage" charts below show how much of the daily needs can be covered by 300 grams of the food.
6
100 g
300 g
1 cubic inch - 17g 1 slice (1 oz) - 28g 1 oz - 28.35g 1 cup, shredded - 113g 1 cup, diced - 132g 1 cup, melted - 244g
Vitamin C
Vit. C
Vitamin D
Vit. D
Vitamin A
Vit. A
Vitamin E
Vit. E
Vitamin B1
Vit. B1
Vitamin B2
Vit. B2
Vitamin B3
Vit. B3
Vitamin B5
Vit. B5
Vitamin B6
Vit. B6
Vitamin B12
Vit. B12
Vitamin K
Vit. K
Folate
Folate
0%
9%
110%
14%
7.3%
99%
1.1%
25%
15%
138%
6%
20%
6
100 g
300 g
0.25 tsp, whole - 0.5g 1 tbsp, whole - 6g
Vitamin C
Vit. C
Vitamin D
Vit. D
Vitamin A
Vit. A
Vitamin E
Vit. E
Vitamin B1
Vit. B1
Vitamin B2
Vit. B2
Vitamin B3
Vit. B3
Vitamin B5
Vit. B5
Vitamin B6
Vit. B6
Vitamin B12
Vit. B12
Vitamin K
Vit. K
Folate
Folate
26%
0%
21%
67%
157%
75%
86%
0%
100%
0%
14%
7.5%
All nutrients comparison - raw data values
Nutrient
DV% diff.
Iron
0.14mg
66.36mg
828%
Manganese
0.027mg
3.333mg
144%
Copper
0.03mg
0.867mg
93%
Magnesium
27mg
366mg
81%
Saturated fat
18.867g
1.535g
79%
Potassium
76mg
1788mg
50%
Vitamin B1
0.029mg
0.628mg
50%
Vitamin B12
1.1µg
0µg
46%
Fiber
0g
10.5g
42%
Selenium
28.5µg
5.2µg
42%
Cholesterol
99mg
0mg
33%
Vitamin A
330µg
64µg
30%
Vitamin B3
0.059mg
4.579mg
28%
Vitamin B6
0.066mg
0.435mg
28%
Calcium
710mg
931mg
22%
Sodium
653mg
168mg
21%
Fats
33.31g
22.27g
17%
Vitamin E
0.71mg
3.33mg
17%
Carbs
3.09g
44.24g
14%
Monounsaturated fat
9.246g
14.04g
12%
Polyunsaturated fat
1.421g
3.279g
12%
Zinc
3.64mg
4.8mg
11%
Protein
22.87g
17.81g
10%
Vitamin C
0mg
7.7mg
9%
Vitamin B2
0.428mg
0.327mg
8%
Vitamin B5
0.41mg
8%
Phosphorus
455mg
499mg
6%
Folate
27µg
10µg
4%
Vitamin D*
24 IU
0 IU
3%
Vitamin D
0.6µg
0µg
3%
Vitamin K
2.4µg
5.4µg
3%
Calories
404kcal
375kcal
1%
Choline
16.5mg
24.7mg
1%
Protein per 100 calories
5.7g
4.7g
N/A
Calories per 10 g protein
177kcal
211kcal
N/A
Weight per 100 calories
25g
27g
N/A
Unsaturated / Saturated Fat ratio
0.57
11
N/A
Net carbs
3.09g
33.74g
N/A
Sugar
0.48g
2.25g
N/A
Trans fat
0.917g
N/A
Tryptophan
0.547mg
0%
Threonine
1.044mg
0%
Isoleucine
1.206mg
0%
Leucine
1.939mg
0%
Lysine
1.025mg
0%
Methionine
0.547mg
0%
Phenylalanine
1.074mg
0%
Valine
1.404mg
0%
Histidine
0.547mg
0%
Omega-3 - EPA
0.01g
0g
N/A
Omega-3 - DHA
0.001g
0g
N/A
Omega-3 - DPA
0.017g
0g
N/A
Omega-6 - Eicosadienoic acid
0.007g
N/A
Macronutrient Comparison
Macronutrient breakdown side-by-side comparison
3
23%
33%
3%
37%
4%
Protein:
22.87 g
Fats:
33.31 g
Carbs:
3.09 g
Water:
37.02 g
Other:
3.71 g
2
18%
22%
44%
8%
8%
Protein:
17.81 g
Fats:
22.27 g
Carbs:
44.24 g
Water:
8.06 g
Other:
7.62 g
Contains
more
Protein Protein
+28.4%
Contains
more
Fats Fats
+49.6%
Contains
more
Water Water
+359.3%
Contains
more
Carbs Carbs
+1331.7%
Contains
more
Other Other
+105.4%
Fat Type Comparison
Fat type breakdown side-by-side comparison
0
64%
31%
5%
Saturated fat:
Sat. Fat
18.867 g
Monounsaturated fat:
Mono. Fat
9.246 g
Polyunsaturated fat:
Poly. Fat
1.421 g
3
8%
74%
17%
Saturated fat:
Sat. Fat
1.535 g
Monounsaturated fat:
Mono. Fat
14.04 g
Polyunsaturated fat:
Poly. Fat
3.279 g
Contains
less
Sat. Fat Saturated fat
-91.9%
Contains
more
Mono. Fat Monounsaturated fat
+51.8%
Contains
more
Poly. Fat Polyunsaturated fat
+130.8%