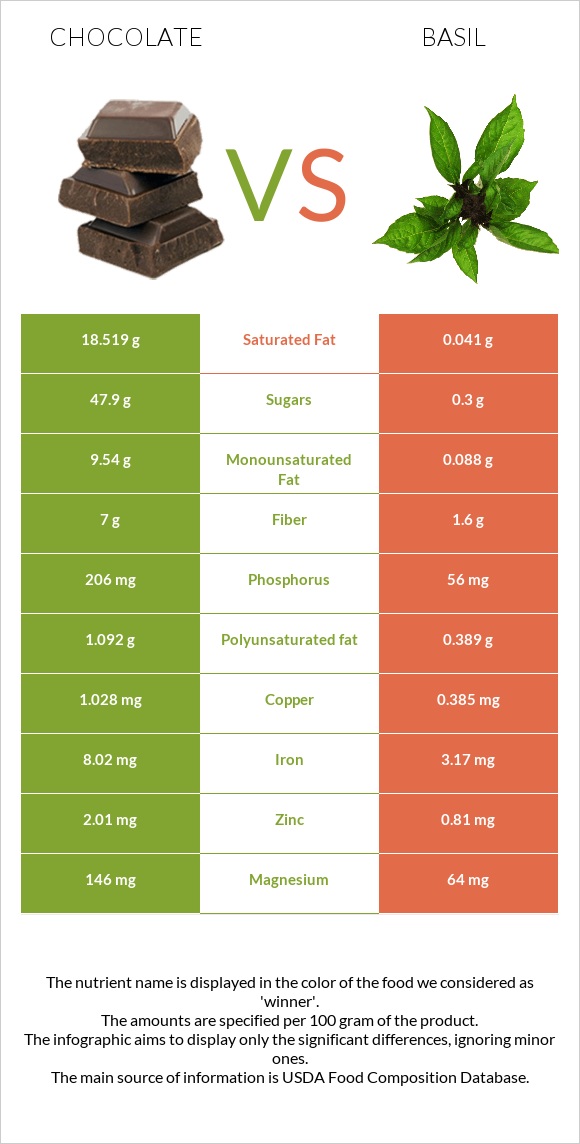
What are the main differences between chocolate and basil? Chocolate is richer in copper, iron, fiber, phosphorus, magnesium, and manganese, yet basil is richer in vitamin K, vitamin A, and calcium. Basil's daily need coverage for vitamin K is 339% higher. Chocolate has 452 times more saturated fat than basil. Chocolate has 18.519g of saturated fat, while basil has 0.041g. Chocolate has a lower glycemic index than basil. We used Chocolate, dark, 45- 59% cacao solids and Basil, fresh types in this comparison.
Infographic
Mineral Comparison
Mineral comparison score is based on the number of minerals by which one or the other food is richer. The "coverage" charts below show how much of the daily needs can be covered by 300 grams of the food.
8
100 g
300 g
1 oz - 28.35g 1 bar - 162g
Magnesium
Magnesium
Calcium
Calcium
Potassium
Potassium
Iron
Iron
Copper
Copper
Zinc
Zinc
Phosphorus
Phosphorus
Sodium
Sodium
Manganese
Manganese
Selenium
Selenium
104%
17%
49%
301%
343%
55%
88%
3.1%
185%
16%
2
100 g
300 g
5 leaves - 2.5g 2 tbsp, chopped - 5.3g 0.25 cup leaves, whole - 6g
Magnesium
Magnesium
Calcium
Calcium
Potassium
Potassium
Iron
Iron
Copper
Copper
Zinc
Zinc
Phosphorus
Phosphorus
Sodium
Sodium
Manganese
Manganese
Selenium
Selenium
46%
53%
26%
119%
128%
22%
24%
0.52%
150%
1.6%
Vitamin Comparison
Vitamin comparison score is based on the number of vitamins by which one or the other food is richer. The "coverage" charts below show how much of the daily needs can be covered by 300 grams of the food.
2
100 g
300 g
1 oz - 28.35g 1 bar - 162g
Vitamin C
Vit. C
Vitamin D
Vit. D
Vitamin A
Vit. A
Vitamin E
Vit. E
Vitamin B1
Vit. B1
Vitamin B2
Vit. B2
Vitamin B3
Vit. B3
Vitamin B5
Vit. B5
Vitamin B6
Vit. B6
Vitamin B12
Vit. B12
Vitamin K
Vit. K
Folate
Folate
0%
0%
0.67%
11%
6.3%
12%
14%
18%
9.7%
29%
20%
0%
9
100 g
300 g
5 leaves - 2.5g 2 tbsp, chopped - 5.3g 0.25 cup leaves, whole - 6g
Vitamin C
Vit. C
Vitamin D
Vit. D
Vitamin A
Vit. A
Vitamin E
Vit. E
Vitamin B1
Vit. B1
Vitamin B2
Vit. B2
Vitamin B3
Vit. B3
Vitamin B5
Vit. B5
Vitamin B6
Vit. B6
Vitamin B12
Vit. B12
Vitamin K
Vit. K
Folate
Folate
60%
0%
88%
16%
8.5%
18%
17%
13%
36%
0%
1037%
51%
All nutrients comparison - raw data values
Nutrient
DV% diff.
Vitamin K
8.1µg
414.8µg
339%
Saturated fat
18.519g
0.041g
84%
Copper
1.028mg
0.385mg
71%
Iron
8.02mg
3.17mg
61%
Fats
31.28g
0.64g
47%
Vitamin A
2µg
264µg
29%
Calories
546kcal
23kcal
26%
Monounsaturated fat
9.54g
0.088g
24%
Fiber
7g
1.6g
22%
Phosphorus
206mg
56mg
21%
Vitamin C
18mg
20%
Carbs
61.17g
2.65g
20%
Magnesium
146mg
64mg
20%
Folate
68µg
17%
Calcium
56mg
177mg
12%
Manganese
1.419mg
1.148mg
12%
Zinc
2.01mg
0.81mg
11%
Caffeine
43mg
0mg
11%
Vitamin B12
0.23µg
0µg
10%
Vitamin B6
0.042mg
0.155mg
9%
Potassium
559mg
295mg
8%
Selenium
3µg
0.3µg
5%
Polyunsaturated fat
1.092g
0.389g
5%
Protein
4.88g
3.15g
3%
Cholesterol
8mg
0mg
3%
Vitamin E
0.54mg
0.8mg
2%
Vitamin B2
0.05mg
0.076mg
2%
Vitamin B5
0.297mg
0.209mg
2%
Choline
11.4mg
2%
Sodium
24mg
4mg
1%
Vitamin B1
0.025mg
0.034mg
1%
Vitamin B3
0.725mg
0.902mg
1%
Protein per 100 calories
0.89g
14g
N/A
Calories per 10 g protein
1119kcal
73kcal
N/A
Weight per 100 calories
18g
435g
N/A
Unsaturated / Saturated Fat ratio
0.57
12
N/A
Net carbs
54.17g
1.05g
N/A
Sugar
47.9g
0.3g
N/A
Trans fat
0.112g
0g
N/A
Tryptophan
0.039mg
0%
Threonine
0.104mg
0%
Isoleucine
0.104mg
0%
Leucine
0.191mg
0%
Lysine
0.11mg
0%
Methionine
0.036mg
0%
Phenylalanine
0.13mg
0%
Valine
0.127mg
0%
Histidine
0.051mg
0%
Fructose
0g
0.02g
0%
Omega-3 - EPA
0.001g
0g
N/A
Omega-3 - ALA
0.085g
N/A
Omega-6 - Eicosadienoic acid
0.001g
N/A
Omega-6 - Linoleic acid
0.947g
N/A
Macronutrient Comparison
Macronutrient breakdown side-by-side comparison
4
5%
31%
61%
2%
Protein:
4.88 g
Fats:
31.28 g
Carbs:
61.17 g
Water:
0.97 g
Other:
1.7 g
1
3%
3%
92%
Protein:
3.15 g
Fats:
0.64 g
Carbs:
2.65 g
Water:
92.06 g
Other:
1.5 g
Contains
more
Protein Protein
+54.9%
Contains
more
Fats Fats
+4787.5%
Contains
more
Carbs Carbs
+2208.3%
Contains
more
Other Other
+13.3%
Contains
more
Water Water
+9390.7%
Fat Type Comparison
Fat type breakdown side-by-side comparison
2
64%
33%
4%
Saturated fat:
Sat. Fat
18.519 g
Monounsaturated fat:
Mono. Fat
9.54 g
Polyunsaturated fat:
Poly. Fat
1.092 g
1
8%
17%
75%
Saturated fat:
Sat. Fat
0.041 g
Monounsaturated fat:
Mono. Fat
0.088 g
Polyunsaturated fat:
Poly. Fat
0.389 g
Contains
more
Mono. Fat Monounsaturated fat
+10740.9%
Contains
more
Poly. Fat Polyunsaturated fat
+180.7%
Contains
less
Sat. Fat Saturated fat
-99.8%
Carbohydrate type comparison
Carbohydrate type breakdown side-by-side comparison
2
97%
3%
Starch:
0 g
Sucrose:
46.25 g
Glucose:
0 g
Fructose:
0 g
Lactose:
1.65 g
Maltose:
0 g
Galactose:
0 g
3
6%
6%
87%
Starch:
0 g
Sucrose:
0 g
Glucose:
0.02 g
Fructose:
0.02 g
Lactose:
0 g
Maltose:
0 g
Galactose:
0.27 g
Contains
more
Sucrose Sucrose
+∞%
Contains
more
Lactose Lactose
+∞%
Contains
more
Glucose Glucose
+∞%
Contains
more
Fructose Fructose
+∞%
Contains
more
Galactose Galactose
+∞%
~equal in
Starch
~0g
~equal in
Maltose
~0g