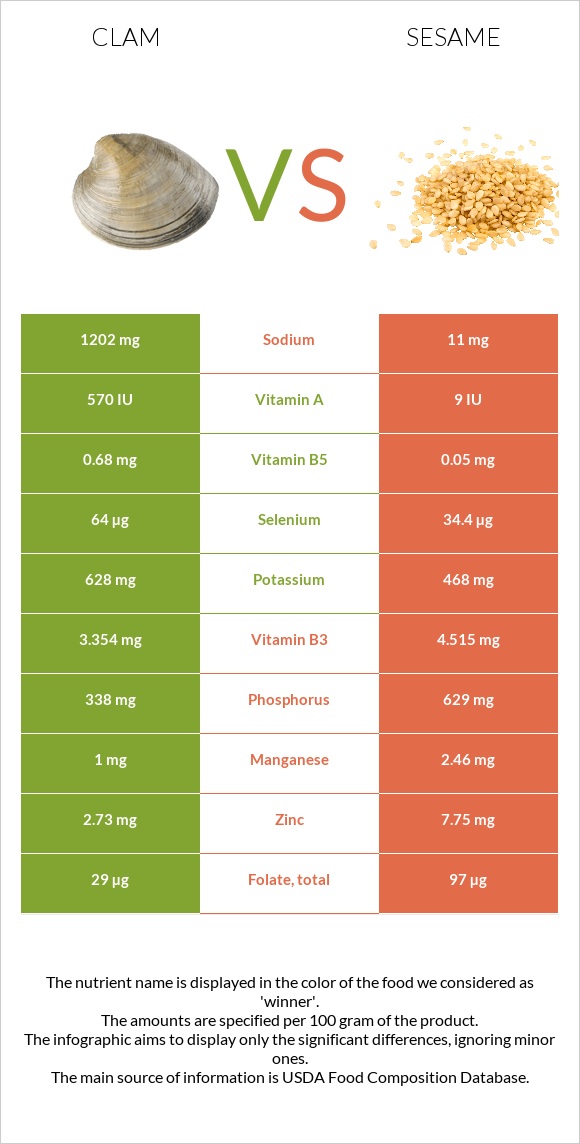
Important differences between clam and sesame Clam has more vitamin B12 and selenium; however, sesame has more copper, iron, calcium, magnesium, manganese, vitamin B1, and vitamin B6. Clam's daily need coverage for vitamin B12 is 4120% more. Clam has 109 times more sodium than sesame. Clam has 1202mg of sodium, while sesame has 11mg. The food varieties used in the comparison are Mollusks, clam, mixed species, cooked, moist heat and Seeds, sesame seeds, whole, dried .
Infographic
Mineral Comparison
Mineral comparison score is based on the number of minerals by which one or the other food is richer. The "coverage" charts below show how much of the daily needs can be covered by 300 grams of the food.
2
100 g
300 g
3 oz - 85g 20 small - 190g
Magnesium
Magnesium
Calcium
Calcium
Potassium
Potassium
Iron
Iron
Copper
Copper
Zinc
Zinc
Phosphorus
Phosphorus
Sodium
Sodium
Manganese
Manganese
Selenium
Selenium
13%
28%
55%
105%
229%
74%
145%
157%
130%
349%
8
100 g
300 g
1 tbsp - 9g 1 cup - 144g
Magnesium
Magnesium
Calcium
Calcium
Potassium
Potassium
Iron
Iron
Copper
Copper
Zinc
Zinc
Phosphorus
Phosphorus
Sodium
Sodium
Manganese
Manganese
Selenium
Selenium
251%
293%
41%
546%
1361%
211%
270%
1.4%
321%
188%
Vitamin Comparison
Vitamin comparison score is based on the number of vitamins by which one or the other food is richer. The "coverage" charts below show how much of the daily needs can be covered by 300 grams of the food.
5
100 g
300 g
3 oz - 85g 20 small - 190g
Vitamin C
Vit. C
Vitamin D
Vit. D
Vitamin A
Vit. A
Vitamin E
Vit. E
Vitamin B1
Vit. B1
Vitamin B2
Vit. B2
Vitamin B3
Vit. B3
Vitamin B5
Vit. B5
Vitamin B6
Vit. B6
Vitamin B12
Vit. B12
Vitamin K
Vit. K
Folate
Folate
74%
0%
57%
0%
38%
98%
63%
41%
25%
12361%
0%
22%
5
100 g
300 g
1 tbsp - 9g 1 cup - 144g
Vitamin C
Vit. C
Vitamin D
Vit. D
Vitamin A
Vit. A
Vitamin E
Vit. E
Vitamin B1
Vit. B1
Vitamin B2
Vit. B2
Vitamin B3
Vit. B3
Vitamin B5
Vit. B5
Vitamin B6
Vit. B6
Vitamin B12
Vit. B12
Vitamin K
Vit. K
Folate
Folate
0%
0%
0%
5%
198%
57%
85%
3%
182%
0%
0%
73%
All nutrients comparison - raw data values
Nutrient
DV% diff.
Vitamin B12
98.89µg
0µg
4120%
Copper
0.688mg
4.082mg
377%
Iron
2.81mg
14.55mg
147%
Polyunsaturated fat
0.552g
21.773g
141%
Calcium
92mg
975mg
88%
Magnesium
18mg
351mg
79%
Fats
1.95g
49.67g
73%
Manganese
1mg
2.46mg
63%
Selenium
64µg
34.4µg
54%
Vitamin B1
0.15mg
0.791mg
53%
Sodium
1202mg
11mg
52%
Vitamin B6
0.11mg
0.79mg
52%
Fiber
0g
11.8g
47%
Zinc
2.73mg
7.75mg
46%
Monounsaturated fat
0.172g
18.759g
46%
Phosphorus
338mg
629mg
42%
Saturated fat
0.188g
6.957g
31%
Vitamin C
22.1mg
0mg
25%
Cholesterol
67mg
0mg
22%
Calories
148kcal
573kcal
21%
Vitamin A
171µg
0µg
19%
Folate
29µg
97µg
17%
Protein
25.55g
17.73g
16%
Vitamin B2
0.426mg
0.247mg
14%
Vitamin B5
0.68mg
0.05mg
13%
Vitamin B3
3.354mg
4.515mg
7%
Carbs
5.13g
23.45g
6%
Potassium
628mg
468mg
5%
Choline
25.6mg
5%
Vitamin E
0.25mg
2%
Protein per 100 calories
17g
3.1g
N/A
Calories per 10 g protein
58kcal
323kcal
N/A
Weight per 100 calories
68g
17g
N/A
Unsaturated / Saturated Fat ratio
3.9
5.8
N/A
Net carbs
5.13g
11.65g
N/A
Sugar
0.3g
N/A
Tryptophan
0.286mg
0.388mg
0%
Threonine
1.099mg
0.736mg
0%
Isoleucine
1.112mg
0.763mg
0%
Leucine
1.798mg
1.358mg
0%
Lysine
1.909mg
0.569mg
0%
Methionine
0.576mg
0.586mg
0%
Phenylalanine
0.915mg
0.94mg
0%
Valine
1.116mg
0.99mg
0%
Histidine
0.49mg
0.522mg
0%
Omega-3 - EPA
0.138g
0g
N/A
Omega-3 - DHA
0.146g
0g
N/A
Omega-3 - DPA
0.104g
0g
N/A
Macronutrient Comparison
Macronutrient breakdown side-by-side comparison
2
26%
2%
5%
64%
4%
Protein:
25.55 g
Fats:
1.95 g
Carbs:
5.13 g
Water:
63.64 g
Other:
3.73 g
3
18%
50%
23%
5%
4%
Protein:
17.73 g
Fats:
49.67 g
Carbs:
23.45 g
Water:
4.69 g
Other:
4.46 g
Contains
more
Protein Protein
+44.1%
Contains
more
Water Water
+1256.9%
Contains
more
Fats Fats
+2447.2%
Contains
more
Carbs Carbs
+357.1%
Contains
more
Other Other
+19.6%
Fat Type Comparison
Fat type breakdown side-by-side comparison
1
21%
19%
61%
Saturated fat:
Sat. Fat
0.188 g
Monounsaturated fat:
Mono. Fat
0.172 g
Polyunsaturated fat:
Poly. Fat
0.552 g
2
15%
40%
46%
Saturated fat:
Sat. Fat
6.957 g
Monounsaturated fat:
Mono. Fat
18.759 g
Polyunsaturated fat:
Poly. Fat
21.773 g
Contains
less
Sat. Fat Saturated fat
-97.3%
Contains
more
Mono. Fat Monounsaturated fat
+10806.4%
Contains
more
Poly. Fat Polyunsaturated fat
+3844.4%