
Cookie, with peanut butter filling, chocolate-coated vs. Butter cookie — In-Depth Nutrition Comparison
Compare
A recap on the differences between cookie, with peanut butter filling, chocolate-coated and butter cookie
- Cookie, with peanut butter filling, chocolate-coated has more copper, fats, vitamin E, and manganese; however, butter cookie is higher in vitamin B1, vitamin B2, vitamin A, and vitamin B12.
- Cookie, with peanut butter filling, chocolate-coated covers your daily copper needs 43% more than butter cookie.
- Butter cookie contains 7 times less vitamin E than cookie, with peanut butter filling, chocolate-coated. Cookie, with peanut butter filling, chocolate-coated contains 4.32mg of vitamin E, while butter cookie contains 0.58mg.
- Butter cookie has less saturated fat.
Food varieties used in this article are Cookie, with peanut butter filling, chocolate-coated and Cookies, butter, commercially prepared, enriched.
Infographic
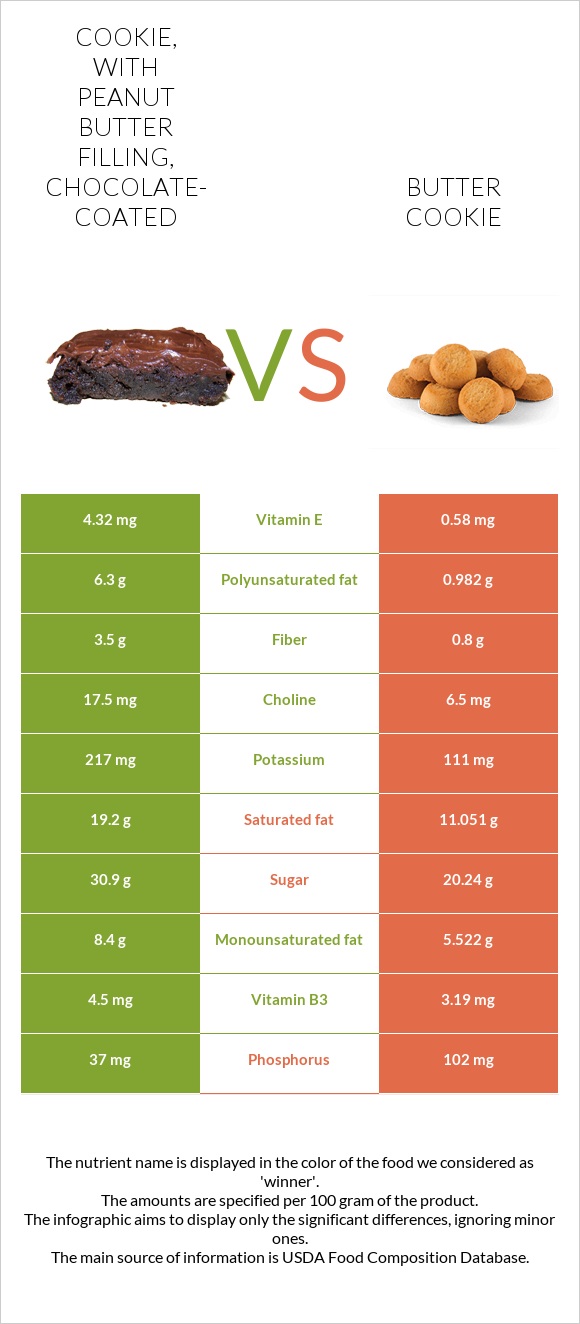
Infographic link
Mineral Comparison
The mineral comparison score is based on which food has a more favorable amount of each mineral. The �coverage� charts below show how much of the daily mineral needs are covered by the selected amount of each food.
| Contains more MagnesiumMagnesium | +41.7% |
| Contains more CalciumCalcium | +20.7% |
| Contains more PotassiumPotassium | +95.5% |
| Contains more CopperCopper | +192.5% |
| Contains more ManganeseManganese | +301.2% |
| Contains more ZincZinc | +90% |
| Contains more PhosphorusPhosphorus | +175.7% |
| Contains less SodiumSodium | -24% |
| Contains more SeleniumSelenium | +15.1% |
Vitamin Comparison
The vitamin comparison score is based on the number of vitamins in which one food is richer than the other. The �coverage� charts below show how much of the daily vitamin needs are covered by the selected amount of each food.
| Contains more Vitamin EVitamin E | +644.8% |
| Contains more Vitamin B3Vitamin B3 | +41.1% |
| Contains more Vitamin B6Vitamin B6 | +183.3% |
| Contains more Vitamin KVitamin K | +176.5% |
| Contains more Vitamin DVitamin D | +∞% |
| Contains more Vitamin AVitamin A | +∞% |
| Contains more Vitamin B1Vitamin B1 | +164.3% |
| Contains more Vitamin B2Vitamin B2 | +272.2% |
| Contains more Vitamin B12Vitamin B12 | +3500% |
| Contains more FolateFolate | +20.6% |
All nutrients comparison - raw data values
| Nutrient |  |
 |
DV% diff. |
| Copper | 0.585mg | 0.2mg | 43% |
| Cholesterol | 0mg | 117mg | 39% |
| Saturated fat | 19.2g | 11.051g | 37% |
| Polyunsaturated fat | 6.3g | 0.982g | 35% |
| Fats | 35.3g | 18.8g | 25% |
| Vitamin E | 4.32mg | 0.58mg | 25% |
| Manganese | 0.682mg | 0.17mg | 22% |
| Vitamin B1 | 0.14mg | 0.37mg | 19% |
| Vitamin B2 | 0.09mg | 0.335mg | 19% |
| Vitamin A | 0µg | 165µg | 18% |
| Vitamin B12 | 0.01µg | 0.36µg | 15% |
| Fiber | 3.5g | 0.8g | 11% |
| Phosphorus | 37mg | 102mg | 9% |
| Vitamin B3 | 4.5mg | 3.19mg | 8% |
| Monounsaturated fat | 8.4g | 5.522g | 7% |
| Calories | 562kcal | 467kcal | 5% |
| Carbs | 52.9g | 68.9g | 5% |
| Vitamin B6 | 0.102mg | 0.036mg | 5% |
| Caffeine | 21mg | 0mg | 5% |
| Protein | 8.1g | 6.1g | 4% |
| Sodium | 371mg | 282mg | 4% |
| Potassium | 217mg | 111mg | 3% |
| Vitamin K | 4.7µg | 1.7µg | 3% |
| Folate | 63µg | 76µg | 3% |
| Vitamin D* | 0 IU | 16 IU | 2% |
| Vitamin D | 0µg | 0.4µg | 2% |
| Iron | 2.1mg | 2.22mg | 2% |
| Zinc | 0.2mg | 0.38mg | 2% |
| Selenium | 7.3µg | 8.4µg | 2% |
| Choline | 17.5mg | 6.5mg | 2% |
| Magnesium | 17mg | 12mg | 1% |
| Calcium | 35mg | 29mg | 1% |
| Protein per 100 calories | 1.4g | 1.3g | N/A |
| Calories per 10 g protein | 694kcal | 766kcal | N/A |
| Weight per 100 calories | 18g | 21g | N/A |
| Unsaturated / Saturated Fat ratio | 0.77 | 0.59 | N/A |
| Net carbs | 49.4g | 68.1g | N/A |
| Sugar | 30.9g | 20.24g | N/A |
| Vitamin B5 | 0.484mg | 0.488mg | 0% |
| Trans fat | 0.27g | N/A | |
| Tryptophan | 0.082mg | 0.084mg | 0% |
| Threonine | 0.271mg | 0.215mg | 0% |
| Isoleucine | 0.285mg | 0.277mg | 0% |
| Leucine | 0.529mg | 0.471mg | 0% |
| Lysine | 0.278mg | 0.308mg | 0% |
| Methionine | 0.105mg | 0.131mg | 0% |
| Phenylalanine | 0.415mg | 0.299mg | 0% |
| Valine | 0.337mg | 0.315mg | 0% |
| Histidine | 0.2mg | 0.136mg | 0% |
| Omega-3 (EPA) | 0g | 0.011g | N/A |
| Omega-3 (DHA) | 0g | 0.007g | N/A |
Macronutrient Comparison
Macronutrient breakdown side-by-side comparison
Protein:
8.1 g
Fats:
35.3 g
Carbs:
52.9 g
Water:
1.8 g
Other:
1.9 g
Protein:
6.1 g
Fats:
18.8 g
Carbs:
68.9 g
Water:
4.6 g
Other:
1.6 g
| Contains more ProteinProtein | +32.8% |
| Contains more FatsFats | +87.8% |
| Contains more CarbsCarbs | +30.2% |
| Contains more WaterWater | +155.6% |
Fat Type Comparison
Fat type breakdown side-by-side comparison
Saturated fat:
Sat. Fat
19.2 g
Monounsaturated fat:
Mono. Fat
8.4 g
Polyunsaturated fat:
Poly. Fat
6.3 g
Saturated fat:
Sat. Fat
11.051 g
Monounsaturated fat:
Mono. Fat
5.522 g
Polyunsaturated fat:
Poly. Fat
0.982 g
| Contains more Mono. FatMonounsaturated fat | +52.1% |
| Contains more Poly. FatPolyunsaturated fat | +541.5% |
| Contains less Sat. FatSaturated fat | -42.4% |