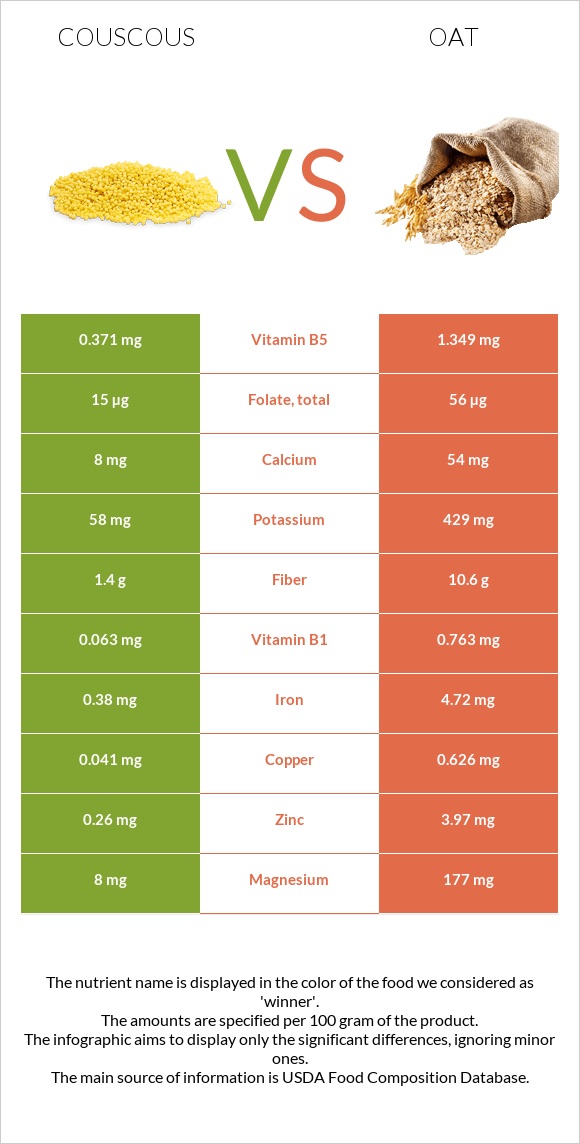
What are the differences between couscous and oats? The amount of manganese, phosphorus, copper, vitamin B1, iron, magnesium, fiber, zinc, vitamin B5, and potassium in oats is higher than in couscous. Oats' daily need coverage for manganese is 210% more. We used Couscous, cooked and Oats types in this article.
Infographic
Mineral Comparison
Mineral comparison score is based on the number of minerals by which one or the other food is richer. The "coverage" charts below show how much of the daily needs can be covered by 300 grams of the food.
1
100 g
300 g
1 oz, dry, yields - 86g 1 cup, cooked - 157g 1 cup, dry, yields - 528g
Magnesium
Magnesium
Calcium
Calcium
Potassium
Potassium
Iron
Iron
Copper
Copper
Zinc
Zinc
Phosphorus
Phosphorus
Sodium
Sodium
Manganese
Manganese
Selenium
Selenium
5.7%
2.4%
5.1%
14%
14%
7.1%
9.4%
0.65%
11%
150%
9
100 g
300 g
1 cup - 156g
Magnesium
Magnesium
Calcium
Calcium
Potassium
Potassium
Iron
Iron
Copper
Copper
Zinc
Zinc
Phosphorus
Phosphorus
Sodium
Sodium
Manganese
Manganese
Selenium
Selenium
126%
16%
38%
177%
209%
108%
224%
0.26%
641%
0%
Vitamin Comparison
Vitamin comparison score is based on the number of vitamins by which one or the other food is richer. The "coverage" charts below show how much of the daily needs can be covered by 300 grams of the food.
2
100 g
300 g
1 oz, dry, yields - 86g 1 cup, cooked - 157g 1 cup, dry, yields - 528g
Vitamin C
Vit. C
Vitamin D
Vit. D
Vitamin A
Vit. A
Vitamin E
Vit. E
Vitamin B1
Vit. B1
Vitamin B2
Vit. B2
Vitamin B3
Vit. B3
Vitamin B5
Vit. B5
Vitamin B6
Vit. B6
Vitamin B12
Vit. B12
Vitamin K
Vit. K
Folate
Folate
0%
0%
0%
2.6%
16%
6.2%
18%
22%
12%
0%
0.25%
11%
5
100 g
300 g
1 cup - 156g
Vitamin C
Vit. C
Vitamin D
Vit. D
Vitamin A
Vit. A
Vitamin E
Vit. E
Vitamin B1
Vit. B1
Vitamin B2
Vit. B2
Vitamin B3
Vit. B3
Vitamin B5
Vit. B5
Vitamin B6
Vit. B6
Vitamin B12
Vit. B12
Vitamin K
Vit. K
Folate
Folate
0%
0%
0%
0%
191%
32%
18%
81%
27%
0%
0%
42%
All nutrients comparison - raw data values
Nutrient
DV% diff.
Manganese
0.084mg
4.916mg
210%
Phosphorus
22mg
523mg
72%
Copper
0.041mg
0.626mg
65%
Vitamin B1
0.063mg
0.763mg
58%
Iron
0.38mg
4.72mg
54%
Selenium
27.5µg
50%
Magnesium
8mg
177mg
40%
Fiber
1.4g
10.6g
37%
Zinc
0.26mg
3.97mg
34%
Protein
3.79g
16.89g
26%
Vitamin B5
0.371mg
1.349mg
20%
Polyunsaturated fat
0.064g
2.535g
16%
Calories
112kcal
389kcal
14%
Carbs
23.22g
66.27g
14%
Potassium
58mg
429mg
11%
Fats
0.16g
6.9g
10%
Folate
15µg
56µg
10%
Vitamin B2
0.027mg
0.139mg
9%
Calcium
8mg
54mg
5%
Vitamin B6
0.051mg
0.119mg
5%
Saturated fat
0.029g
1.217g
5%
Monounsaturated fat
0.022g
2.178g
5%
Vitamin E
0.13mg
1%
Choline
3.3mg
1%
Protein per 100 calories
3.4g
4.3g
N/A
Calories per 10 g protein
296kcal
230kcal
N/A
Weight per 100 calories
89g
26g
N/A
Unsaturated / Saturated Fat ratio
3
3.9
N/A
Net carbs
21.82g
55.67g
N/A
Sugar
0.1g
N/A
Sodium
5mg
2mg
0%
Vitamin B3
0.983mg
0.961mg
0%
Vitamin K
0.1µg
0%
Tryptophan
0.049mg
0.234mg
0%
Threonine
0.1mg
0.575mg
0%
Isoleucine
0.147mg
0.694mg
0%
Leucine
0.259mg
1.284mg
0%
Lysine
0.073mg
0.701mg
0%
Methionine
0.059mg
0.312mg
0%
Phenylalanine
0.184mg
0.895mg
0%
Valine
0.162mg
0.937mg
0%
Histidine
0.077mg
0.405mg
0%
Macronutrient Comparison
Macronutrient breakdown side-by-side comparison
1
4%
23%
73%
Protein:
3.79 g
Fats:
0.16 g
Carbs:
23.22 g
Water:
72.57 g
Other:
0.26 g
4
17%
7%
66%
8%
2%
Protein:
16.89 g
Fats:
6.9 g
Carbs:
66.27 g
Water:
8.22 g
Other:
1.72 g
Contains
more
Water Water
+782.8%
Contains
more
Protein Protein
+345.6%
Contains
more
Fats Fats
+4212.5%
Contains
more
Carbs Carbs
+185.4%
Contains
more
Other Other
+561.5%
Fat Type Comparison
Fat type breakdown side-by-side comparison
1
25%
19%
56%
Saturated fat:
Sat. Fat
0.029 g
Monounsaturated fat:
Mono. Fat
0.022 g
Polyunsaturated fat:
Poly. Fat
0.064 g
2
21%
37%
43%
Saturated fat:
Sat. Fat
1.217 g
Monounsaturated fat:
Mono. Fat
2.178 g
Polyunsaturated fat:
Poly. Fat
2.535 g
Contains
less
Sat. Fat Saturated fat
-97.6%
Contains
more
Mono. Fat Monounsaturated fat
+9800%
Contains
more
Poly. Fat Polyunsaturated fat
+3860.9%