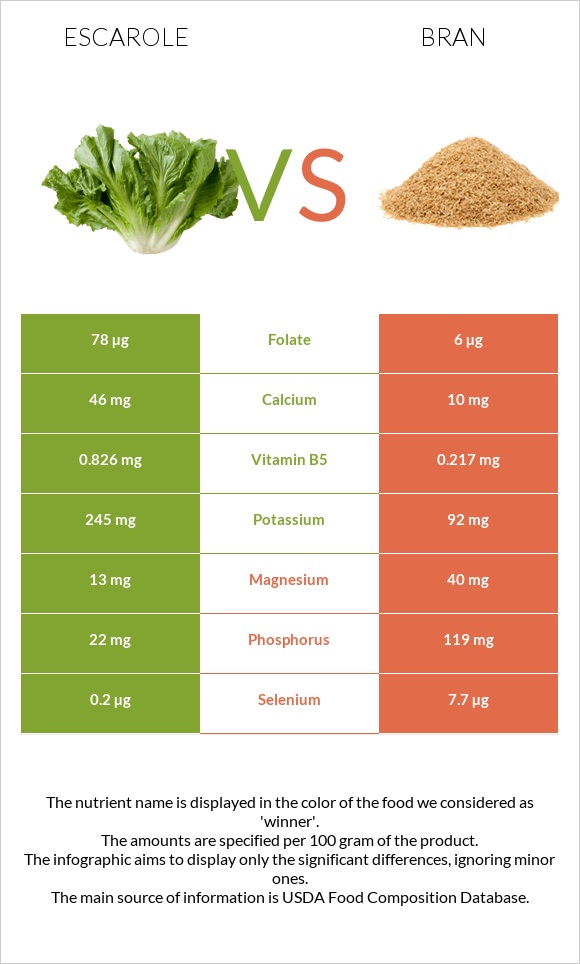
How are escarole and bran different? Escarole is richer in vitamin A, folate, and vitamin B5, while bran is higher in manganese, phosphorus, selenium, vitamin B1, and magnesium. Escarole covers your daily need for vitamin A, 38% more than bran. Escarole contains 13 times more folate than bran. Escarole contains 78µg of folate, while bran contains 6µg. Bran has a higher glycemic index (56) than escarole (0). Escarole, cooked, boiled, drained, no salt added and Oat bran, cooked types were used in this article.
Infographic
Mineral Comparison
Mineral comparison score is based on the number of minerals by which one or the other food is richer. The "coverage" charts below show how much of the daily needs can be covered by 300 grams of the food.
4
100 g
300 g
1 cup - 150g
Magnesium
Magnesium
Calcium
Calcium
Potassium
Potassium
Iron
Iron
Copper
Copper
Zinc
Zinc
Phosphorus
Phosphorus
Sodium
Sodium
Manganese
Manganese
Selenium
Selenium
9.3%
14%
22%
27%
29%
19%
9.4%
2.5%
50%
1.1%
6
100 g
300 g
1 cup - 219g
Magnesium
Magnesium
Calcium
Calcium
Potassium
Potassium
Iron
Iron
Copper
Copper
Zinc
Zinc
Phosphorus
Phosphorus
Sodium
Sodium
Manganese
Manganese
Selenium
Selenium
29%
3%
8.1%
33%
22%
14%
51%
0.13%
126%
42%
Vitamin Comparison
Vitamin comparison score is based on the number of vitamins by which one or the other food is richer. The "coverage" charts below show how much of the daily needs can be covered by 300 grams of the food.
8
100 g
300 g
1 cup - 150g
Vitamin C
Vit. C
Vitamin D
Vit. D
Vitamin A
Vit. A
Vitamin E
Vit. E
Vitamin B1
Vit. B1
Vitamin B2
Vit. B2
Vitamin B3
Vit. B3
Vitamin B5
Vit. B5
Vitamin B6
Vit. B6
Vitamin B12
Vit. B12
Vitamin K
Vit. K
Folate
Folate
11%
0%
31%
8%
15%
14%
5.9%
50%
3.7%
0%
530%
59%
2
100 g
300 g
1 cup - 219g
Vitamin C
Vit. C
Vitamin D
Vit. D
Vitamin A
Vit. A
Vitamin E
Vit. E
Vitamin B1
Vit. B1
Vitamin B2
Vit. B2
Vitamin B3
Vit. B3
Vitamin B5
Vit. B5
Vitamin B6
Vit. B6
Vitamin B12
Vit. B12
Vitamin K
Vit. K
Folate
Folate
0%
0%
0%
0%
40%
7.8%
2.7%
13%
5.8%
0%
0%
4.5%
All nutrients comparison - raw data values
Nutrient
DV% diff.
Vitamin K
211.9µg
177%
Manganese
0.385mg
0.964mg
25%
Folate
78µg
6µg
18%
Phosphorus
22mg
119mg
14%
Selenium
0.2µg
7.7µg
14%
Vitamin B5
0.826mg
0.217mg
12%
Vitamin A
94µg
0µg
10%
Vitamin B1
0.059mg
0.16mg
8%
Magnesium
13mg
40mg
6%
Potassium
245mg
92mg
5%
Protein
1.15g
3.21g
4%
Vitamin C
3.3mg
0mg
4%
Calcium
46mg
10mg
4%
Carbs
3.07g
11.44g
3%
Vitamin E
0.4mg
3%
Choline
15.4mg
3%
Iron
0.72mg
0.88mg
2%
Copper
0.087mg
0.066mg
2%
Vitamin B2
0.062mg
0.034mg
2%
Polyunsaturated fat
0.081g
0.339g
2%
Calories
19kcal
40kcal
1%
Fats
0.18g
0.86g
1%
Fiber
2.8g
2.6g
1%
Zinc
0.69mg
0.53mg
1%
Sodium
19mg
1mg
1%
Vitamin B3
0.312mg
0.144mg
1%
Vitamin B6
0.016mg
0.025mg
1%
Saturated fat
0.042g
0.163g
1%
Monounsaturated fat
0.004g
0.291g
1%
Protein per 100 calories
6.1g
8g
N/A
Calories per 10 g protein
165kcal
125kcal
N/A
Weight per 100 calories
526g
250g
N/A
Net carbs
0.27g
8.84g
N/A
Sugar
0.23g
N/A
Tryptophan
0.005mg
0.057mg
0%
Threonine
0.046mg
0.086mg
0%
Isoleucine
0.066mg
0.114mg
0%
Leucine
0.09mg
0.235mg
0%
Lysine
0.058mg
0.13mg
0%
Methionine
0.013mg
0.057mg
0%
Phenylalanine
0.049mg
0.155mg
0%
Valine
0.058mg
0.165mg
0%
Histidine
0.021mg
0.07mg
0%
Macronutrient Comparison
Macronutrient breakdown side-by-side comparison
2
3%
94%
Protein:
1.15 g
Fats:
0.18 g
Carbs:
3.07 g
Water:
94.29 g
Other:
1.31 g
3
3%
11%
84%
Protein:
3.21 g
Fats:
0.86 g
Carbs:
11.44 g
Water:
84 g
Other:
0.49 g
Contains
more
Water Water
+12.3%
Contains
more
Other Other
+167.3%
Contains
more
Protein Protein
+179.1%
Contains
more
Fats Fats
+377.8%
Contains
more
Carbs Carbs
+272.6%
Fat Type Comparison
Fat type breakdown side-by-side comparison
1
33%
3%
64%
Saturated fat:
Sat. Fat
0.042 g
Monounsaturated fat:
Mono. Fat
0.004 g
Polyunsaturated fat:
Poly. Fat
0.081 g
2
21%
37%
43%
Saturated fat:
Sat. Fat
0.163 g
Monounsaturated fat:
Mono. Fat
0.291 g
Polyunsaturated fat:
Poly. Fat
0.339 g
Contains
less
Sat. Fat Saturated fat
-74.2%
Contains
more
Mono. Fat Monounsaturated fat
+7175%
Contains
more
Poly. Fat Polyunsaturated fat
+318.5%