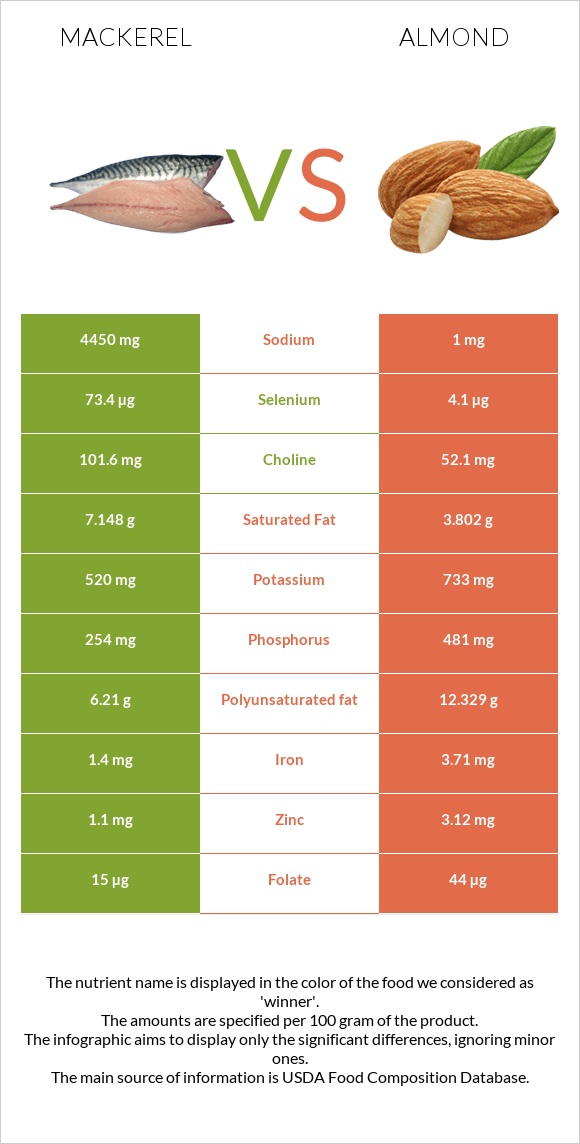
Differences between mackerel and almonds Mackerel is higher in vitamin B12, selenium, and vitamin D*; however, almonds are richer in vitamin E, copper, vitamin B2, fiber, magnesium, and phosphorus. Mackerel's daily need coverage for vitamin B12 is 500% higher. Almonds have less sodium. The food types used in this comparison are Fish, mackerel, salted and Nuts, almonds .
Infographic
Mineral Comparison
Mineral comparison score is based on the number of minerals by which one or the other food is richer. The "coverage" charts below show how much of the daily needs can be covered by 300 grams of the food.
1
100 g
300 g
1 cubic inch, boneless - 17g 1 piece (5-1/2" x 1-1/2" x 1/2") - 80g 1 cup, cooked - 136g
Magnesium
Magnesium
Calcium
Calcium
Potassium
Potassium
Iron
Iron
Copper
Copper
Zinc
Zinc
Phosphorus
Phosphorus
Sodium
Sodium
Manganese
Manganese
Selenium
Selenium
43%
20%
46%
53%
33%
30%
109%
580%
0%
400%
9
100 g
300 g
1 almond - 1.2g 1 oz (23 whole kernels) - 28.35g 1 cup, sliced - 92g 1 cup, ground - 95g 1 cup, slivered - 108g 1 cup, whole - 143g
Magnesium
Magnesium
Calcium
Calcium
Potassium
Potassium
Iron
Iron
Copper
Copper
Zinc
Zinc
Phosphorus
Phosphorus
Sodium
Sodium
Manganese
Manganese
Selenium
Selenium
193%
81%
65%
139%
344%
85%
206%
0.13%
284%
22%
Vitamin Comparison
Vitamin comparison score is based on the number of vitamins by which one or the other food is richer. The "coverage" charts below show how much of the daily needs can be covered by 300 grams of the food.
5
100 g
300 g
1 cubic inch, boneless - 17g 1 piece (5-1/2" x 1-1/2" x 1/2") - 80g 1 cup, cooked - 136g
Vitamin C
Vit. C
Vitamin D
Vit. D
Vitamin A
Vit. A
Vitamin E
Vit. E
Vitamin B1
Vit. B1
Vitamin B2
Vit. B2
Vitamin B3
Vit. B3
Vitamin B5
Vit. B5
Vitamin B6
Vit. B6
Vitamin B12
Vit. B12
Vitamin K
Vit. K
Folate
Folate
0%
378%
16%
48%
5%
44%
62%
0%
95%
1500%
20%
11%
5
100 g
300 g
1 almond - 1.2g 1 oz (23 whole kernels) - 28.35g 1 cup, sliced - 92g 1 cup, ground - 95g 1 cup, slivered - 108g 1 cup, whole - 143g
Vitamin C
Vit. C
Vitamin D
Vit. D
Vitamin A
Vit. A
Vitamin E
Vit. E
Vitamin B1
Vit. B1
Vitamin B2
Vit. B2
Vitamin B3
Vit. B3
Vitamin B5
Vit. B5
Vitamin B6
Vit. B6
Vitamin B12
Vit. B12
Vitamin K
Vit. K
Folate
Folate
0%
0%
0%
513%
51%
263%
68%
28%
32%
0%
0%
33%
All nutrients comparison - raw data values
Nutrient
DV% diff.
Vitamin B12
12µg
0µg
500%
Sodium
4450mg
1mg
193%
Vitamin E
2.38mg
25.63mg
155%
Vitamin D*
1006 IU
0 IU
126%
Vitamin D
25.2µg
0µg
126%
Selenium
73.4µg
4.1µg
126%
Copper
0.1mg
1.031mg
103%
Manganese
2.179mg
95%
Vitamin B2
0.19mg
1.138mg
73%
Monounsaturated fat
8.32g
31.551g
58%
Magnesium
60mg
270mg
50%
Fiber
0g
12.5g
50%
Polyunsaturated fat
6.21g
12.329g
41%
Fats
25.1g
49.93g
38%
Cholesterol
95mg
0mg
32%
Phosphorus
254mg
481mg
32%
Iron
1.4mg
3.71mg
29%
Vitamin B6
0.41mg
0.137mg
21%
Calcium
66mg
269mg
20%
Zinc
1.1mg
3.12mg
18%
Vitamin B1
0.02mg
0.205mg
15%
Saturated fat
7.148g
3.802g
15%
Calories
305kcal
579kcal
14%
Vitamin B5
0.471mg
9%
Choline
101.6mg
52.1mg
9%
Carbs
0g
21.55g
7%
Vitamin K
7.8µg
0µg
7%
Folate
15µg
44µg
7%
Potassium
520mg
733mg
6%
Protein
18.5g
21.15g
5%
Vitamin A
47µg
0µg
5%
Vitamin B3
3.3mg
3.618mg
2%
Protein per 100 calories
6.1g
3.7g
N/A
Calories per 10 g protein
165kcal
274kcal
N/A
Weight per 100 calories
33g
17g
N/A
Unsaturated / Saturated Fat ratio
2
12
N/A
Net carbs
0g
9.05g
N/A
Sugar
0g
4.35g
N/A
Starch
0.72g
0%
Trans fat
0.015g
N/A
Tryptophan
0.211mg
0%
Threonine
0.601mg
0%
Isoleucine
0.751mg
0%
Leucine
1.473mg
0%
Lysine
0.568mg
0%
Methionine
0.157mg
0%
Phenylalanine
1.132mg
0%
Valine
0.855mg
0%
Histidine
0.539mg
0%
Fructose
0.11g
0%
Omega-3 - EPA
1.619g
0g
N/A
Omega-3 - DHA
2.965g
0g
N/A
Omega-3 - ALA
0.003g
N/A
Omega-3 - DPA
0.391g
0g
N/A
Omega-6 - Eicosadienoic acid
0.002g
N/A
Omega-6 - Linoleic acid
12.32g
N/A
Macronutrient Comparison
Macronutrient breakdown side-by-side comparison
2
19%
25%
43%
13%
Protein:
18.5 g
Fats:
25.1 g
Carbs:
0 g
Water:
43 g
Other:
13.4 g
3
21%
50%
22%
4%
3%
Protein:
21.15 g
Fats:
49.93 g
Carbs:
21.55 g
Water:
4.41 g
Other:
2.96 g
Contains
more
Water Water
+875.1%
Contains
more
Other Other
+352.7%
Contains
more
Protein Protein
+14.3%
Contains
more
Fats Fats
+98.9%
Contains
more
Carbs Carbs
+∞%
Fat Type Comparison
Fat type breakdown side-by-side comparison
0
33%
38%
29%
Saturated fat:
Sat. Fat
7.148 g
Monounsaturated fat:
Mono. Fat
8.32 g
Polyunsaturated fat:
Poly. Fat
6.21 g
3
8%
66%
26%
Saturated fat:
Sat. Fat
3.802 g
Monounsaturated fat:
Mono. Fat
31.551 g
Polyunsaturated fat:
Poly. Fat
12.329 g
Contains
less
Sat. Fat Saturated fat
-46.8%
Contains
more
Mono. Fat Monounsaturated fat
+279.2%
Contains
more
Poly. Fat Polyunsaturated fat
+98.5%