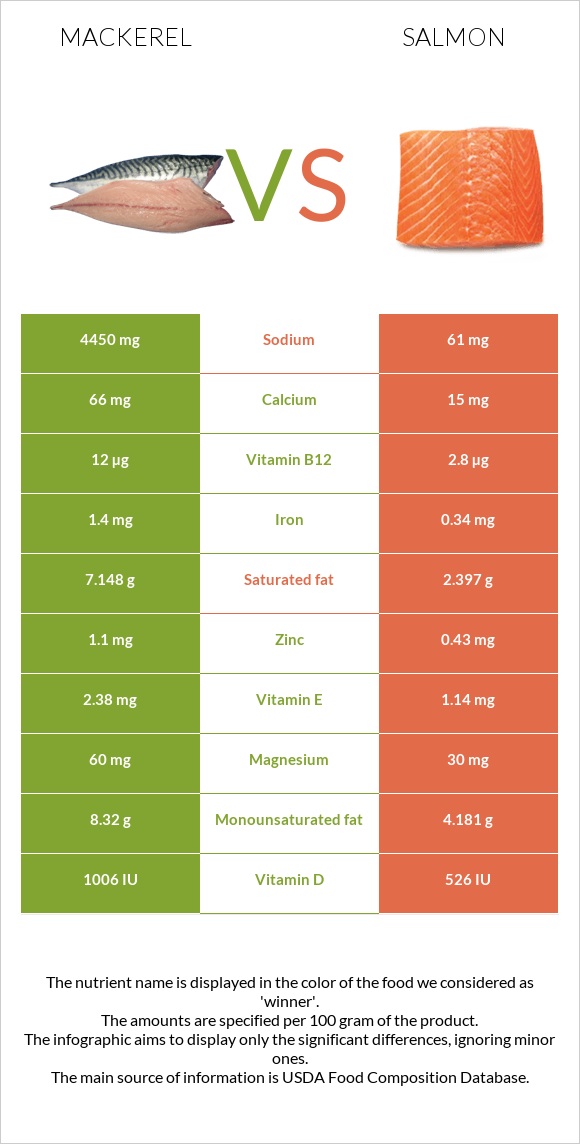
What are the differences between mackerel and salmon? Mackerel is higher in vitamin B12, vitamin D*, selenium, and iron, yet salmon is higher in vitamin B3, vitamin B1, and vitamin B6. Mackerel's daily need coverage for vitamin B12 is 383% more. Mackerel has 73 times more sodium than salmon. While mackerel has 4450mg of sodium, salmon has only 61mg. We used Fish, mackerel, salted and Fish, salmon, Atlantic, farmed, cooked, dry heat types in this article.
Infographic
Mineral Comparison
Mineral comparison score is based on the number of minerals by which one or the other food is richer. The "coverage" charts below show how much of the daily needs can be covered by 300 grams of the food.
7
100 g
300 g
1 cubic inch, boneless - 17g 1 piece (5-1/2" x 1-1/2" x 1/2") - 80g 1 cup, cooked - 136g
Magnesium
Magnesium
Calcium
Calcium
Potassium
Potassium
Iron
Iron
Copper
Copper
Zinc
Zinc
Phosphorus
Phosphorus
Sodium
Sodium
Manganese
Manganese
Selenium
Selenium
43%
20%
46%
53%
33%
30%
109%
580%
0%
400%
2
100 g
300 g
3 oz - 85g 0.5 fillet - 178g
Magnesium
Magnesium
Calcium
Calcium
Potassium
Potassium
Iron
Iron
Copper
Copper
Zinc
Zinc
Phosphorus
Phosphorus
Sodium
Sodium
Manganese
Manganese
Selenium
Selenium
21%
4.5%
34%
13%
16%
12%
108%
8%
2.1%
226%
Vitamin Comparison
Vitamin comparison score is based on the number of vitamins by which one or the other food is richer. The "coverage" charts below show how much of the daily needs can be covered by 300 grams of the food.
5
100 g
300 g
1 cubic inch, boneless - 17g 1 piece (5-1/2" x 1-1/2" x 1/2") - 80g 1 cup, cooked - 136g
Vitamin C
Vit. C
Vitamin D
Vit. D
Vitamin A
Vit. A
Vitamin E
Vit. E
Vitamin B1
Vit. B1
Vitamin B2
Vit. B2
Vitamin B3
Vit. B3
Vitamin B5
Vit. B5
Vitamin B6
Vit. B6
Vitamin B12
Vit. B12
Vitamin K
Vit. K
Folate
Folate
0%
378%
16%
48%
5%
44%
62%
0%
95%
1500%
20%
11%
7
100 g
300 g
3 oz - 85g 0.5 fillet - 178g
Vitamin C
Vit. C
Vitamin D
Vit. D
Vitamin A
Vit. A
Vitamin E
Vit. E
Vitamin B1
Vit. B1
Vitamin B2
Vit. B2
Vitamin B3
Vit. B3
Vitamin B5
Vit. B5
Vitamin B6
Vit. B6
Vitamin B12
Vit. B12
Vitamin K
Vit. K
Folate
Folate
12%
197%
23%
23%
85%
31%
151%
89%
149%
350%
0.25%
26%
All nutrients comparison - raw data values
Nutrient
DV% diff.
Vitamin B12
12µg
2.8µg
383%
Sodium
4450mg
61mg
191%
Vitamin D
25.2µg
13.1µg
61%
Vitamin D*
1006 IU
526 IU
60%
Selenium
73.4µg
41.4µg
58%
Vitamin B3
3.3mg
8.045mg
30%
Vitamin B5
1.475mg
30%
Vitamin B1
0.02mg
0.34mg
27%
Saturated fat
7.148g
2.397g
22%
Fats
25.1g
12.35g
20%
Vitamin B6
0.41mg
0.647mg
18%
Iron
1.4mg
0.34mg
13%
Cholesterol
95mg
63mg
11%
Polyunsaturated fat
6.21g
4.553g
11%
Monounsaturated fat
8.32g
4.181g
10%
Vitamin E
2.38mg
1.14mg
8%
Protein
18.5g
22.1g
7%
Magnesium
60mg
30mg
7%
Copper
0.1mg
0.049mg
6%
Zinc
1.1mg
0.43mg
6%
Vitamin K
7.8µg
0.1µg
6%
Calories
305kcal
206kcal
5%
Calcium
66mg
15mg
5%
Folate
15µg
34µg
5%
Vitamin C
0mg
3.7mg
4%
Potassium
520mg
384mg
4%
Vitamin B2
0.19mg
0.135mg
4%
Vitamin A
47µg
69µg
2%
Choline
101.6mg
90.5mg
2%
Manganese
0.016mg
1%
Protein per 100 calories
6.1g
11g
N/A
Calories per 10 g protein
165kcal
93kcal
N/A
Weight per 100 calories
33g
49g
N/A
Unsaturated / Saturated Fat ratio
2
3.6
N/A
Phosphorus
254mg
252mg
0%
Tryptophan
0.248mg
0%
Threonine
0.969mg
0%
Isoleucine
1.018mg
0%
Leucine
1.796mg
0%
Lysine
2.03mg
0%
Methionine
0.654mg
0%
Phenylalanine
0.863mg
0%
Valine
1.139mg
0%
Histidine
0.651mg
0%
Omega-3 - EPA
1.619g
0.69g
N/A
Omega-3 - DHA
2.965g
1.457g
N/A
Omega-3 - DPA
0.391g
0.17g
N/A
Macronutrient Comparison
Macronutrient breakdown side-by-side comparison
2
19%
25%
43%
13%
Protein:
18.5 g
Fats:
25.1 g
Carbs:
0 g
Water:
43 g
Other:
13.4 g
2
22%
12%
65%
Protein:
22.1 g
Fats:
12.35 g
Carbs:
0 g
Water:
64.75 g
Other:
0.8 g
Contains
more
Fats Fats
+103.2%
Contains
more
Other Other
+1575%
Contains
more
Protein Protein
+19.5%
Contains
more
Water Water
+50.6%
Fat Type Comparison
Fat type breakdown side-by-side comparison
2
33%
38%
29%
Saturated fat:
Sat. Fat
7.148 g
Monounsaturated fat:
Mono. Fat
8.32 g
Polyunsaturated fat:
Poly. Fat
6.21 g
1
22%
38%
41%
Saturated fat:
Sat. Fat
2.397 g
Monounsaturated fat:
Mono. Fat
4.181 g
Polyunsaturated fat:
Poly. Fat
4.553 g
Contains
more
Mono. Fat Monounsaturated fat
+99%
Contains
more
Poly. Fat Polyunsaturated fat
+36.4%
Contains
less
Sat. Fat Saturated fat
-66.5%