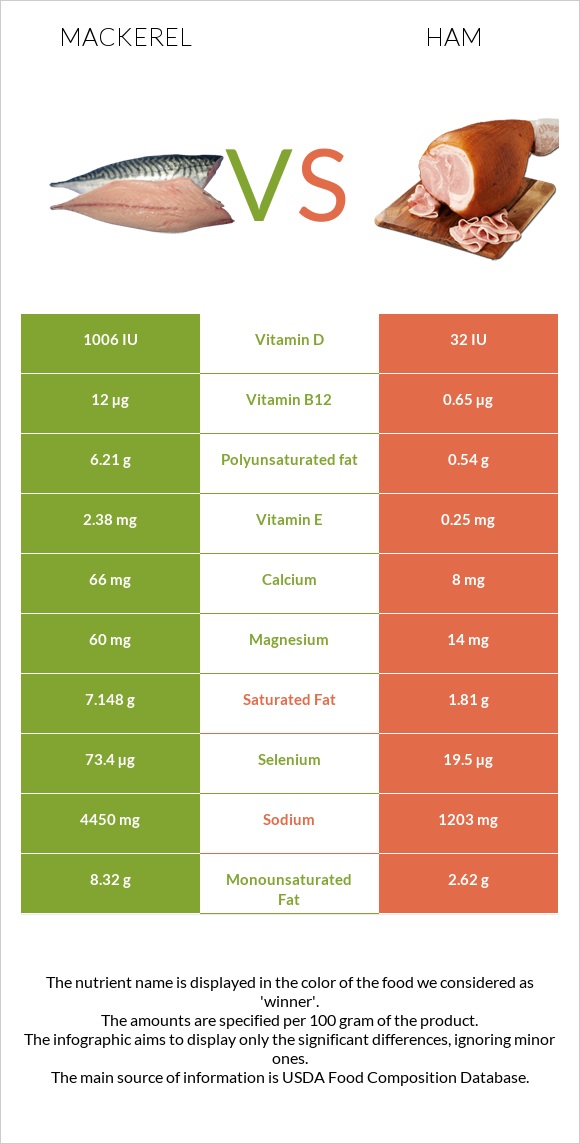
The main differences between mackerel and ham Mackerel has more vitamin B12, vitamin D*, selenium, vitamin E, and magnesium; however, ham has more vitamin B1 and zinc. Daily need coverage for vitamin B12 for mackerel is 473% higher. Ham has 31 times less vitamin D* than mackerel. Mackerel has 1006 IU of vitamin D*, while ham has 32 IU. Ham is lower in saturated fat. Food types used in this article are Fish, mackerel, salted and Pork, cured, ham, boneless, extra lean (approximately 5% fat), roasted .
Infographic
Mineral Comparison
Mineral comparison score is based on the number of minerals by which one or the other food is richer. The "coverage" charts below show how much of the daily needs can be covered by 300 grams of the food.
6
100 g
300 g
1 cubic inch, boneless - 17g 1 piece (5-1/2" x 1-1/2" x 1/2") - 80g 1 cup, cooked - 136g
Magnesium
Magnesium
Calcium
Calcium
Potassium
Potassium
Iron
Iron
Copper
Copper
Zinc
Zinc
Phosphorus
Phosphorus
Sodium
Sodium
Manganese
Manganese
Selenium
Selenium
43%
20%
46%
53%
33%
30%
109%
580%
0%
400%
3
100 g
300 g
3 oz - 85g 1 cup - 140g
Magnesium
Magnesium
Calcium
Calcium
Potassium
Potassium
Iron
Iron
Copper
Copper
Zinc
Zinc
Phosphorus
Phosphorus
Sodium
Sodium
Manganese
Manganese
Selenium
Selenium
10%
2.4%
25%
56%
26%
79%
84%
157%
7%
106%
Vitamin Comparison
Vitamin comparison score is based on the number of vitamins by which one or the other food is richer. The "coverage" charts below show how much of the daily needs can be covered by 300 grams of the food.
6
100 g
300 g
1 cubic inch, boneless - 17g 1 piece (5-1/2" x 1-1/2" x 1/2") - 80g 1 cup, cooked - 136g
Vitamin C
Vit. C
Vitamin D
Vit. D
Vitamin A
Vit. A
Vitamin E
Vit. E
Vitamin B1
Vit. B1
Vitamin B2
Vit. B2
Vitamin B3
Vit. B3
Vitamin B5
Vit. B5
Vitamin B6
Vit. B6
Vitamin B12
Vit. B12
Vitamin K
Vit. K
Folate
Folate
0%
378%
16%
48%
5%
44%
62%
0%
95%
1500%
20%
11%
3
100 g
300 g
3 oz - 85g 1 cup - 140g
Vitamin C
Vit. C
Vitamin D
Vit. D
Vitamin A
Vit. A
Vitamin E
Vit. E
Vitamin B1
Vit. B1
Vitamin B2
Vit. B2
Vitamin B3
Vit. B3
Vitamin B5
Vit. B5
Vitamin B6
Vit. B6
Vitamin B12
Vit. B12
Vitamin K
Vit. K
Folate
Folate
0%
12%
0%
5%
189%
47%
75%
24%
92%
81%
0%
2.3%
All nutrients comparison - raw data values
Nutrient
DV% diff.
Vitamin B12
12µg
0.65µg
473%
Sodium
4450mg
1203mg
141%
Vitamin D*
1006 IU
32 IU
122%
Vitamin D
25.2µg
0.8µg
122%
Selenium
73.4µg
19.5µg
98%
Vitamin B1
0.02mg
0.754mg
61%
Polyunsaturated fat
6.21g
0.54g
38%
Fats
25.1g
5.53g
30%
Saturated fat
7.148g
1.81g
24%
Zinc
1.1mg
2.88mg
16%
Cholesterol
95mg
53mg
14%
Vitamin E
2.38mg
0.25mg
14%
Monounsaturated fat
8.32g
2.62g
14%
Magnesium
60mg
14mg
11%
Calories
305kcal
145kcal
8%
Phosphorus
254mg
196mg
8%
Vitamin B5
0.403mg
8%
Potassium
520mg
287mg
7%
Vitamin K
7.8µg
0µg
7%
Calcium
66mg
8mg
6%
Protein
18.5g
20.93g
5%
Vitamin A
47µg
0µg
5%
Vitamin B3
3.3mg
4.023mg
5%
Folate
15µg
3µg
3%
Choline
101.6mg
85.1mg
3%
Copper
0.1mg
0.079mg
2%
Manganese
0.054mg
2%
Carbs
0g
1.5g
1%
Iron
1.4mg
1.48mg
1%
Vitamin B2
0.19mg
0.202mg
1%
Vitamin B6
0.41mg
0.4mg
1%
Protein per 100 calories
6.1g
14g
N/A
Calories per 10 g protein
165kcal
69kcal
N/A
Weight per 100 calories
33g
69g
N/A
Unsaturated / Saturated Fat ratio
2
1.7
N/A
Net carbs
0g
1.5g
N/A
Tryptophan
0.251mg
0%
Threonine
0.931mg
0%
Isoleucine
0.918mg
0%
Leucine
1.661mg
0%
Lysine
1.775mg
0%
Methionine
0.553mg
0%
Phenylalanine
0.904mg
0%
Valine
0.908mg
0%
Histidine
0.75mg
0%
Omega-3 - EPA
1.619g
0g
N/A
Omega-3 - DHA
2.965g
0g
N/A
Omega-3 - DPA
0.391g
0g
N/A
Macronutrient Comparison
Macronutrient breakdown side-by-side comparison
2
19%
25%
43%
13%
Protein:
18.5 g
Fats:
25.1 g
Carbs:
0 g
Water:
43 g
Other:
13.4 g
3
21%
6%
68%
4%
Protein:
20.93 g
Fats:
5.53 g
Carbs:
1.5 g
Water:
67.67 g
Other:
4.37 g
Contains
more
Fats Fats
+353.9%
Contains
more
Other Other
+206.6%
Contains
more
Protein Protein
+13.1%
Contains
more
Carbs Carbs
+∞%
Contains
more
Water Water
+57.4%
Fat Type Comparison
Fat type breakdown side-by-side comparison
2
33%
38%
29%
Saturated fat:
Sat. Fat
7.148 g
Monounsaturated fat:
Mono. Fat
8.32 g
Polyunsaturated fat:
Poly. Fat
6.21 g
1
36%
53%
11%
Saturated fat:
Sat. Fat
1.81 g
Monounsaturated fat:
Mono. Fat
2.62 g
Polyunsaturated fat:
Poly. Fat
0.54 g
Contains
more
Mono. Fat Monounsaturated fat
+217.6%
Contains
more
Poly. Fat Polyunsaturated fat
+1050%
Contains
less
Sat. Fat Saturated fat
-74.7%