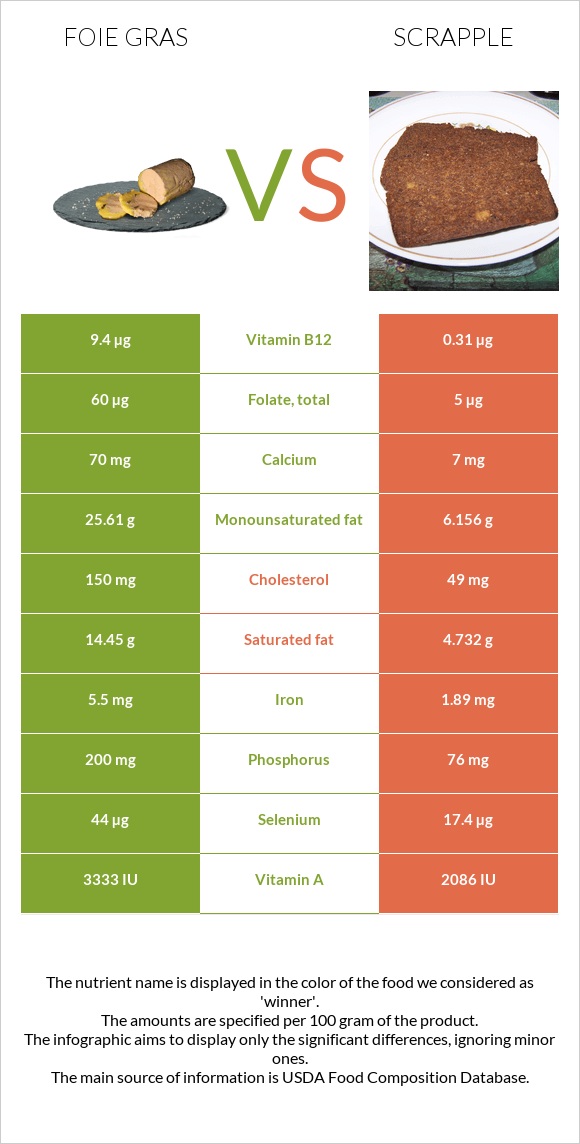
Summary of differences between foie gras and scrapple The amount of vitamin B12, selenium, iron, vitamin A, copper, phosphorus, and folate in foie gras is higher than in scrapple. Foie gras covers your daily need for vitamin B12, 379% more than scrapple. Foie gras contains 12 times more folate than scrapple. While foie gras contains 60µg of folate, scrapple contains only 5µg. The amount of cholesterol in scrapple is lower. These are the specific foods used in this comparison Pate de foie gras, canned (goose liver pate), smoked and Scrapple, pork .
Infographic
Mineral Comparison
Mineral comparison score is based on the number of minerals by which one or the other food is richer. The "coverage" charts below show how much of the daily needs can be covered by 300 grams of the food.
6
100 g
300 g
1 tbsp - 13g 1 oz - 28.35g
Magnesium
Magnesium
Calcium
Calcium
Potassium
Potassium
Iron
Iron
Copper
Copper
Zinc
Zinc
Phosphorus
Phosphorus
Sodium
Sodium
Manganese
Manganese
Selenium
Selenium
9.3%
21%
12%
206%
133%
25%
86%
91%
16%
240%
3
100 g
300 g
1 cubic inch - 17g 1 oz cooked - 25g 2 oz - 56g
Magnesium
Magnesium
Calcium
Calcium
Potassium
Potassium
Iron
Iron
Copper
Copper
Zinc
Zinc
Phosphorus
Phosphorus
Sodium
Sodium
Manganese
Manganese
Selenium
Selenium
9.3%
2.1%
14%
71%
71%
29%
33%
63%
0%
95%
Vitamin Comparison
Vitamin comparison score is based on the number of vitamins by which one or the other food is richer. The "coverage" charts below show how much of the daily needs can be covered by 300 grams of the food.
4
100 g
300 g
1 tbsp - 13g 1 oz - 28.35g
Vitamin C
Vit. C
Vitamin D
Vit. D
Vitamin A
Vit. A
Vitamin E
Vit. E
Vitamin B1
Vit. B1
Vitamin B2
Vit. B2
Vitamin B3
Vit. B3
Vitamin B5
Vit. B5
Vitamin B6
Vit. B6
Vitamin B12
Vit. B12
Vitamin K
Vit. K
Folate
Folate
6.7%
0%
334%
0%
22%
69%
47%
72%
14%
1175%
0%
45%
6
100 g
300 g
1 cubic inch - 17g 1 oz cooked - 25g 2 oz - 56g
Vitamin C
Vit. C
Vitamin D
Vit. D
Vitamin A
Vit. A
Vitamin E
Vit. E
Vitamin B1
Vit. B1
Vitamin B2
Vit. B2
Vitamin B3
Vit. B3
Vitamin B5
Vit. B5
Vitamin B6
Vit. B6
Vitamin B12
Vit. B12
Vitamin K
Vit. K
Folate
Folate
8.3%
4.5%
209%
3%
29%
66%
43%
0%
28%
39%
8.5%
3.8%
All nutrients comparison - raw data values
Nutrient
DV% diff.
Vitamin B12
9.4µg
0.31µg
379%
Monounsaturated fat
25.61g
6.156g
49%
Selenium
44µg
17.4µg
48%
Fats
43.84g
13.87g
46%
Iron
5.5mg
1.89mg
45%
Saturated fat
14.45g
4.732g
44%
Vitamin A
1001µg
626µg
42%
Cholesterol
150mg
49mg
34%
Vitamin B5
1.2mg
24%
Copper
0.4mg
0.212mg
21%
Phosphorus
200mg
76mg
18%
Folate
60µg
5µg
14%
Choline
72.4mg
13%
Calories
462kcal
213kcal
12%
Sodium
697mg
482mg
9%
Protein
11.4g
8.06g
7%
Calcium
70mg
7mg
6%
Manganese
0.12mg
5%
Vitamin B6
0.06mg
0.12mg
5%
Polyunsaturated fat
0.84g
1.664g
5%
Carbs
4.67g
14.06g
3%
Vitamin K
3.4µg
3%
Vitamin D*
13 IU
2%
Vitamin D
0.3µg
2%
Vitamin B1
0.088mg
0.116mg
2%
Vitamin C
2mg
2.5mg
1%
Potassium
138mg
158mg
1%
Fiber
0g
0.3g
1%
Zinc
0.92mg
1.06mg
1%
Vitamin E
0.15mg
1%
Vitamin B2
0.299mg
0.287mg
1%
Vitamin B3
2.51mg
2.273mg
1%
Protein per 100 calories
2.5g
3.8g
N/A
Calories per 10 g protein
405kcal
264kcal
N/A
Weight per 100 calories
22g
47g
N/A
Unsaturated / Saturated Fat ratio
1.8
1.7
N/A
Net carbs
4.67g
13.76g
N/A
Magnesium
13mg
13mg
0%
Sugar
0.2g
N/A
Tryptophan
0.161mg
0%
Threonine
0.507mg
0%
Isoleucine
0.606mg
0%
Leucine
1.029mg
0%
Lysine
0.863mg
0%
Methionine
0.27mg
0%
Phenylalanine
0.567mg
0%
Valine
0.719mg
0%
Histidine
0.303mg
0%
Macronutrient Comparison
Macronutrient breakdown side-by-side comparison
3
11%
44%
5%
37%
3%
Protein:
11.4 g
Fats:
43.84 g
Carbs:
4.67 g
Water:
37.04 g
Other:
3.05 g
2
8%
14%
14%
62%
Protein:
8.06 g
Fats:
13.87 g
Carbs:
14.06 g
Water:
62.47 g
Other:
1.54 g
Contains
more
Protein Protein
+41.4%
Contains
more
Fats Fats
+216.1%
Contains
more
Other Other
+98.1%
Contains
more
Carbs Carbs
+201.1%
Contains
more
Water Water
+68.7%
Fat Type Comparison
Fat type breakdown side-by-side comparison
1
35%
63%
2%
Saturated fat:
Sat. Fat
14.45 g
Monounsaturated fat:
Mono. Fat
25.61 g
Polyunsaturated fat:
Poly. Fat
0.84 g
2
38%
49%
13%
Saturated fat:
Sat. Fat
4.732 g
Monounsaturated fat:
Mono. Fat
6.156 g
Polyunsaturated fat:
Poly. Fat
1.664 g
Contains
more
Mono. Fat Monounsaturated fat
+316%
Contains
less
Sat. Fat Saturated fat
-67.3%
Contains
more
Poly. Fat Polyunsaturated fat
+98.1%