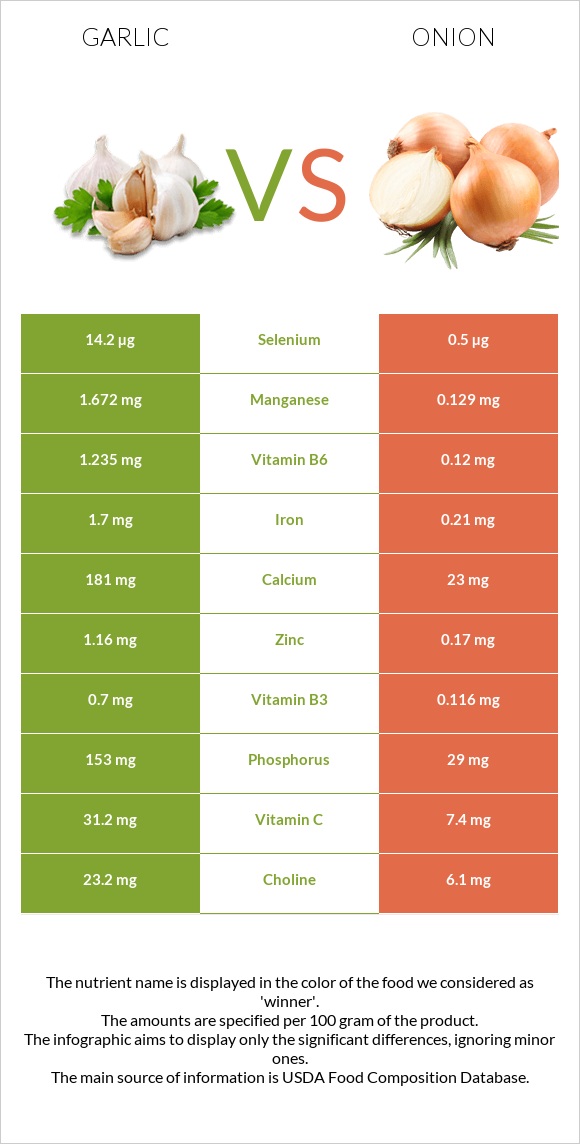
What are the differences between garlic and onions? Garlic is richer than onions in vitamin B6, manganese, copper, vitamin C, selenium, iron, phosphorus, calcium, vitamin B1, and vitamin B5. Garlic's daily need coverage for vitamin B6 is 86% more. Garlic has 28 times more selenium than onions. While garlic has 14.2µg of selenium, onions have only 0.5µg. The glycemic index of onions is lower. We used Garlic, raw and Onions, raw types in this article.
Infographic
Mineral Comparison
Mineral comparison score is based on the number of minerals by which one or the other food is richer. The "coverage" charts below show how much of the daily needs can be covered by 300 grams of the food.
9
100 g
300 g
1 tsp - 2.8g 1 clove - 3g 3 cloves - 9g 1 cup - 136g
Magnesium
Magnesium
Calcium
Calcium
Potassium
Potassium
Iron
Iron
Copper
Copper
Zinc
Zinc
Phosphorus
Phosphorus
Sodium
Sodium
Manganese
Manganese
Selenium
Selenium
18%
54%
35%
64%
100%
32%
66%
2.2%
218%
77%
1
100 g
300 g
1 slice, thin - 9g 1 tbsp chopped - 10g 1 slice, medium (1/8" thick) - 14g 1 slice, large (1/4" thick) - 38g 10 rings - 60g 1 small - 70g 1 medium (2-1/2" dia) - 110g 1 cup, sliced - 115g 1 large - 150g 1 cup, chopped - 160g
Magnesium
Magnesium
Calcium
Calcium
Potassium
Potassium
Iron
Iron
Copper
Copper
Zinc
Zinc
Phosphorus
Phosphorus
Sodium
Sodium
Manganese
Manganese
Selenium
Selenium
7.1%
6.9%
13%
7.9%
13%
4.6%
12%
0.52%
17%
2.7%
Vitamin Comparison
Vitamin comparison score is based on the number of vitamins by which one or the other food is richer. The "coverage" charts below show how much of the daily needs can be covered by 300 grams of the food.
8
100 g
300 g
1 tsp - 2.8g 1 clove - 3g 3 cloves - 9g 1 cup - 136g
Vitamin C
Vit. C
Vitamin D
Vit. D
Vitamin A
Vit. A
Vitamin E
Vit. E
Vitamin B1
Vit. B1
Vitamin B2
Vit. B2
Vitamin B3
Vit. B3
Vitamin B5
Vit. B5
Vitamin B6
Vit. B6
Vitamin B12
Vit. B12
Vitamin K
Vit. K
Folate
Folate
104%
0%
0%
1.6%
50%
25%
13%
36%
285%
0%
4.3%
2.3%
1
100 g
300 g
1 slice, thin - 9g 1 tbsp chopped - 10g 1 slice, medium (1/8" thick) - 14g 1 slice, large (1/4" thick) - 38g 10 rings - 60g 1 small - 70g 1 medium (2-1/2" dia) - 110g 1 cup, sliced - 115g 1 large - 150g 1 cup, chopped - 160g
Vitamin C
Vit. C
Vitamin D
Vit. D
Vitamin A
Vit. A
Vitamin E
Vit. E
Vitamin B1
Vit. B1
Vitamin B2
Vit. B2
Vitamin B3
Vit. B3
Vitamin B5
Vit. B5
Vitamin B6
Vit. B6
Vitamin B12
Vit. B12
Vitamin K
Vit. K
Folate
Folate
25%
0%
0%
0.4%
12%
6.2%
2.2%
7.4%
28%
0%
1%
14%
All nutrients comparison - raw data values
Nutrient
DV% diff.
Vitamin B6
1.235mg
0.12mg
86%
Manganese
1.672mg
0.129mg
67%
Copper
0.299mg
0.039mg
29%
Vitamin C
31.2mg
7.4mg
26%
Selenium
14.2µg
0.5µg
25%
Iron
1.7mg
0.21mg
19%
Phosphorus
153mg
29mg
18%
Calcium
181mg
23mg
16%
Vitamin B1
0.2mg
0.046mg
13%
Protein
6.36g
1.1g
11%
Zinc
1.16mg
0.17mg
9%
Vitamin B5
0.596mg
0.123mg
9%
Carbs
33.06g
9.34g
8%
Potassium
401mg
146mg
8%
Vitamin B2
0.11mg
0.027mg
6%
Calories
149kcal
40kcal
5%
Magnesium
25mg
10mg
4%
Vitamin B3
0.7mg
0.116mg
4%
Folate
3µg
19µg
4%
Choline
23.2mg
6.1mg
3%
Fiber
2.1g
1.7g
2%
Polyunsaturated fat
0.249g
0.017g
2%
Fructose
1.29g
2%
Fats
0.5g
0.1g
1%
Sodium
17mg
4mg
1%
Vitamin K
1.7µg
0.4µg
1%
Protein per 100 calories
4.3g
2.8g
N/A
Calories per 10 g protein
234kcal
364kcal
N/A
Weight per 100 calories
67g
250g
N/A
Net carbs
30.96g
7.64g
N/A
Sugar
1g
4.24g
N/A
Vitamin E
0.08mg
0.02mg
0%
Saturated fat
0.089g
0.042g
0%
Monounsaturated fat
0.011g
0.013g
0%
Tryptophan
0.066mg
0.014mg
0%
Threonine
0.157mg
0.021mg
0%
Isoleucine
0.217mg
0.014mg
0%
Leucine
0.308mg
0.025mg
0%
Lysine
0.273mg
0.039mg
0%
Methionine
0.076mg
0.002mg
0%
Phenylalanine
0.183mg
0.025mg
0%
Valine
0.291mg
0.021mg
0%
Histidine
0.113mg
0.014mg
0%
Macronutrient Comparison
Macronutrient breakdown side-by-side comparison
4
6%
33%
59%
Protein:
6.36 g
Fats:
0.5 g
Carbs:
33.06 g
Water:
58.58 g
Other:
1.5 g
1
9%
89%
Protein:
1.1 g
Fats:
0.1 g
Carbs:
9.34 g
Water:
89.11 g
Other:
0.35 g
Contains
more
Protein Protein
+478.2%
Contains
more
Fats Fats
+400%
Contains
more
Carbs Carbs
+254%
Contains
more
Other Other
+328.6%
Contains
more
Water Water
+52.1%
Fat Type Comparison
Fat type breakdown side-by-side comparison
1
26%
3%
71%
Saturated fat:
Sat. Fat
0.089 g
Monounsaturated fat:
Mono. Fat
0.011 g
Polyunsaturated fat:
Poly. Fat
0.249 g
2
58%
18%
24%
Saturated fat:
Sat. Fat
0.042 g
Monounsaturated fat:
Mono. Fat
0.013 g
Polyunsaturated fat:
Poly. Fat
0.017 g
Contains
more
Poly. Fat Polyunsaturated fat
+1364.7%
Contains
less
Sat. Fat Saturated fat
-52.8%
Contains
more
Mono. Fat Monounsaturated fat
+18.2%