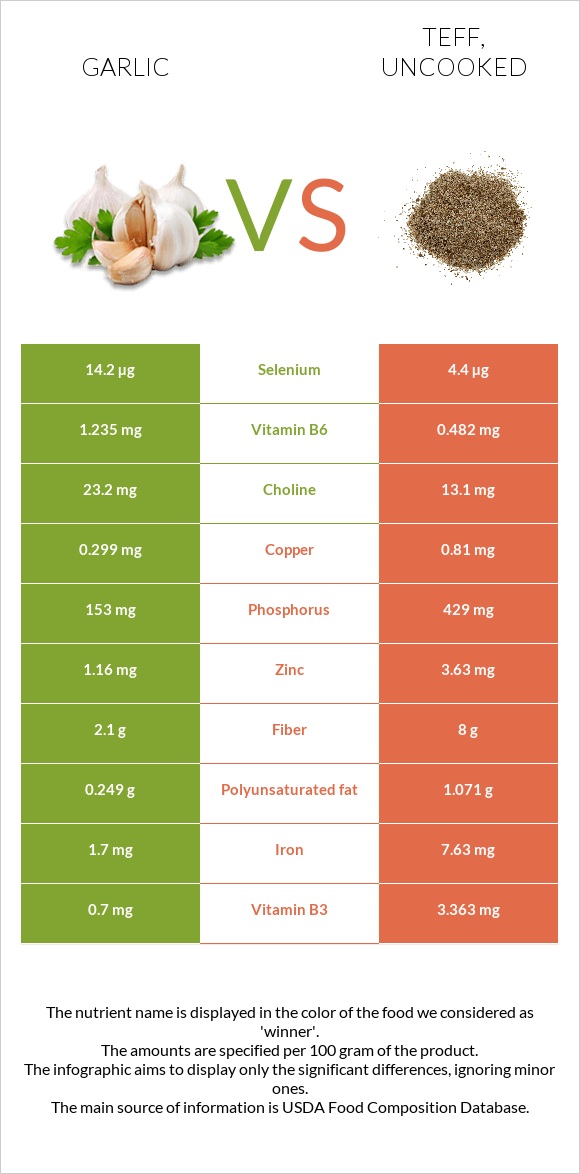
What are the differences between garlic and teff? Garlic is higher in vitamin B6 and selenium, yet teff is higher in manganese, iron, copper, phosphorus, magnesium, fiber, zinc, and vitamin B3. Teff's daily need coverage for manganese is 329% more. Garlic has 3 times more selenium than teff. While garlic has 14.2µg of selenium, teff has only 4.4µg. We used Garlic, raw and Teff, uncooked types in this article.
Infographic
Mineral Comparison
Mineral comparison score is based on the number of minerals by which one or the other food is richer. The "coverage" charts below show how much of the daily needs can be covered by 300 grams of the food.
1
100 g
300 g
1 tsp - 2.8g 1 clove - 3g 3 cloves - 9g 1 cup - 136g
Magnesium
Magnesium
Calcium
Calcium
Potassium
Potassium
Iron
Iron
Copper
Copper
Zinc
Zinc
Phosphorus
Phosphorus
Sodium
Sodium
Manganese
Manganese
Selenium
Selenium
18%
54%
35%
64%
100%
32%
66%
2.2%
218%
77%
7
100 g
300 g
1 cup - 193g
Magnesium
Magnesium
Calcium
Calcium
Potassium
Potassium
Iron
Iron
Copper
Copper
Zinc
Zinc
Phosphorus
Phosphorus
Sodium
Sodium
Manganese
Manganese
Selenium
Selenium
131%
54%
38%
286%
270%
99%
184%
1.6%
1205%
24%
Vitamin Comparison
Vitamin comparison score is based on the number of vitamins by which one or the other food is richer. The "coverage" charts below show how much of the daily needs can be covered by 300 grams of the food.
3
100 g
300 g
1 tsp - 2.8g 1 clove - 3g 3 cloves - 9g 1 cup - 136g
Vitamin C
Vit. C
Vitamin D
Vit. D
Vitamin A
Vit. A
Vitamin E
Vit. E
Vitamin B1
Vit. B1
Vitamin B2
Vit. B2
Vitamin B3
Vit. B3
Vitamin B5
Vit. B5
Vitamin B6
Vit. B6
Vitamin B12
Vit. B12
Vitamin K
Vit. K
Folate
Folate
104%
0%
0%
1.6%
50%
25%
13%
36%
285%
0%
4.3%
2.3%
5
100 g
300 g
1 cup - 193g
Vitamin C
Vit. C
Vitamin D
Vit. D
Vitamin A
Vit. A
Vitamin E
Vit. E
Vitamin B1
Vit. B1
Vitamin B2
Vit. B2
Vitamin B3
Vit. B3
Vitamin B5
Vit. B5
Vitamin B6
Vit. B6
Vitamin B12
Vit. B12
Vitamin K
Vit. K
Folate
Folate
0%
0%
0%
1.6%
98%
62%
63%
57%
111%
0%
4.8%
0%
All nutrients comparison - raw data values
Nutrient
DV% diff.
Manganese
1.672mg
9.24mg
329%
Iron
1.7mg
7.63mg
74%
Vitamin B6
1.235mg
0.482mg
58%
Copper
0.299mg
0.81mg
57%
Phosphorus
153mg
429mg
39%
Magnesium
25mg
184mg
38%
Vitamin C
31.2mg
35%
Fiber
2.1g
8g
24%
Zinc
1.16mg
3.63mg
22%
Selenium
14.2µg
4.4µg
18%
Vitamin B3
0.7mg
3.363mg
17%
Vitamin B1
0.2mg
0.39mg
16%
Starch
36.56g
15%
Protein
6.36g
13.3g
14%
Carbs
33.06g
73.13g
13%
Vitamin B2
0.11mg
0.27mg
12%
Calories
149kcal
367kcal
11%
Vitamin B5
0.596mg
0.942mg
7%
Polyunsaturated fat
0.249g
1.071g
5%
Fats
0.5g
2.38g
3%
Choline
23.2mg
13.1mg
2%
Saturated fat
0.089g
0.449g
2%
Potassium
401mg
427mg
1%
Folate
3µg
1%
Monounsaturated fat
0.011g
0.589g
1%
Fructose
0.47g
1%
Protein per 100 calories
4.3g
3.6g
N/A
Calories per 10 g protein
234kcal
276kcal
N/A
Weight per 100 calories
67g
27g
N/A
Unsaturated / Saturated Fat ratio
2.9
3.7
N/A
Net carbs
30.96g
65.13g
N/A
Calcium
181mg
180mg
0%
Sugar
1g
1.84g
N/A
Sodium
17mg
12mg
0%
Vitamin E
0.08mg
0.08mg
0%
Vitamin K
1.7µg
1.9µg
0%
Tryptophan
0.066mg
0.139mg
0%
Threonine
0.157mg
0.51mg
0%
Isoleucine
0.217mg
0.501mg
0%
Leucine
0.308mg
1.068mg
0%
Lysine
0.273mg
0.376mg
0%
Methionine
0.076mg
0.428mg
0%
Phenylalanine
0.183mg
0.698mg
0%
Valine
0.291mg
0.686mg
0%
Histidine
0.113mg
0.301mg
0%
Omega-3 - ALA
0.135g
N/A
Macronutrient Comparison
Macronutrient breakdown side-by-side comparison
1
6%
33%
59%
Protein:
6.36 g
Fats:
0.5 g
Carbs:
33.06 g
Water:
58.58 g
Other:
1.5 g
4
13%
2%
73%
9%
2%
Protein:
13.3 g
Fats:
2.38 g
Carbs:
73.13 g
Water:
8.82 g
Other:
2.37 g
Contains
more
Water Water
+564.2%
Contains
more
Protein Protein
+109.1%
Contains
more
Fats Fats
+376%
Contains
more
Carbs Carbs
+121.2%
Contains
more
Other Other
+58%
Fat Type Comparison
Fat type breakdown side-by-side comparison
1
26%
3%
71%
Saturated fat:
Sat. Fat
0.089 g
Monounsaturated fat:
Mono. Fat
0.011 g
Polyunsaturated fat:
Poly. Fat
0.249 g
2
21%
28%
51%
Saturated fat:
Sat. Fat
0.449 g
Monounsaturated fat:
Mono. Fat
0.589 g
Polyunsaturated fat:
Poly. Fat
1.071 g
Contains
less
Sat. Fat Saturated fat
-80.2%
Contains
more
Mono. Fat Monounsaturated fat
+5254.5%
Contains
more
Poly. Fat Polyunsaturated fat
+330.1%