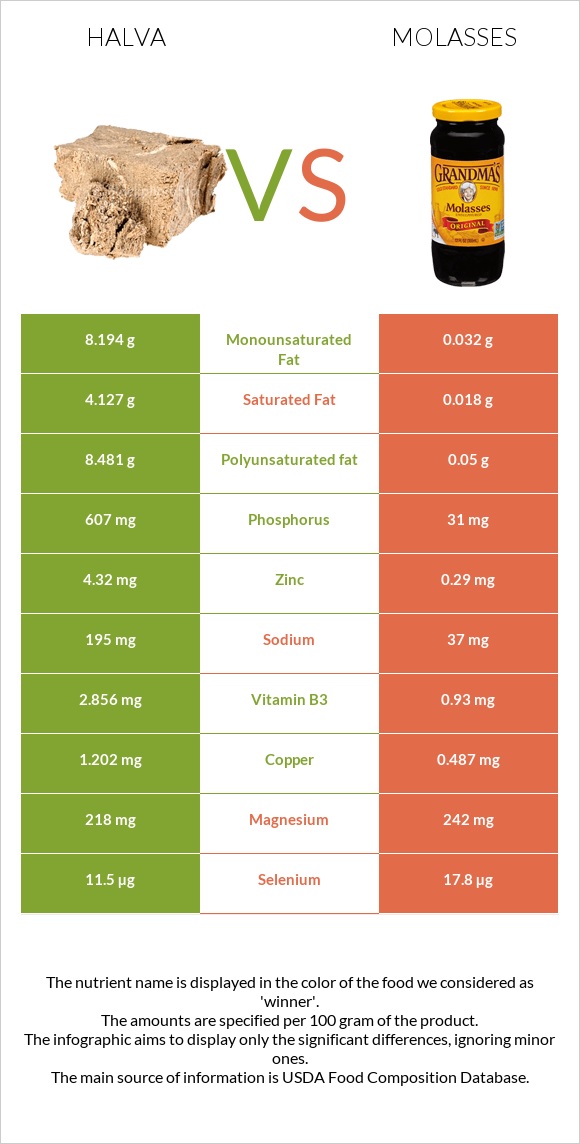
Differences between halva and molasses Halva has more phosphorus, copper, zinc, vitamin B1, and fiber, while molasses have more potassium, manganese, vitamin B6, and calcium. Halva's daily need coverage for phosphorus is 82% higher. The amount of saturated fat in molasses is lower. The food types used in this comparison are Candies, halavah, plain and Molasses .
Infographic
Mineral Comparison
Mineral comparison score is based on the number of minerals by which one or the other food is richer. The "coverage" charts below show how much of the daily needs can be covered by 300 grams of the food.
3
100 g
300 g
1 oz - 28.35g
Magnesium
Magnesium
Calcium
Calcium
Potassium
Potassium
Iron
Iron
Copper
Copper
Zinc
Zinc
Phosphorus
Phosphorus
Sodium
Sodium
Manganese
Manganese
Selenium
Selenium
156%
9.9%
17%
170%
401%
118%
260%
25%
114%
63%
6
100 g
300 g
1 serving 1 tbsp - 20g 1 cup - 337g
Magnesium
Magnesium
Calcium
Calcium
Potassium
Potassium
Iron
Iron
Copper
Copper
Zinc
Zinc
Phosphorus
Phosphorus
Sodium
Sodium
Manganese
Manganese
Selenium
Selenium
173%
62%
129%
177%
162%
7.9%
13%
4.8%
200%
97%
Vitamin Comparison
Vitamin comparison score is based on the number of vitamins by which one or the other food is richer. The "coverage" charts below show how much of the daily needs can be covered by 300 grams of the food.
6
100 g
300 g
1 oz - 28.35g
Vitamin C
Vit. C
Vitamin D
Vit. D
Vitamin A
Vit. A
Vitamin E
Vit. E
Vitamin B1
Vit. B1
Vitamin B2
Vit. B2
Vitamin B3
Vit. B3
Vitamin B5
Vit. B5
Vitamin B6
Vit. B6
Vitamin B12
Vit. B12
Vitamin K
Vit. K
Folate
Folate
0.33%
0%
0%
0%
106%
20%
54%
10%
80%
5%
0%
49%
2
100 g
300 g
1 serving 1 tbsp - 20g 1 cup - 337g
Vitamin C
Vit. C
Vitamin D
Vit. D
Vitamin A
Vit. A
Vitamin E
Vit. E
Vitamin B1
Vit. B1
Vitamin B2
Vit. B2
Vitamin B3
Vit. B3
Vitamin B5
Vit. B5
Vitamin B6
Vit. B6
Vitamin B12
Vit. B12
Vitamin K
Vit. K
Folate
Folate
0%
0%
0%
0%
10%
0.46%
17%
48%
155%
0%
0%
0%
All nutrients comparison - raw data values
Nutrient
DV% diff.
Phosphorus
607mg
31mg
82%
Copper
1.202mg
0.487mg
79%
Polyunsaturated fat
8.481g
0.05g
56%
Potassium
187mg
1464mg
38%
Zinc
4.32mg
0.29mg
37%
Fats
21.52g
0.1g
33%
Vitamin B1
0.424mg
0.041mg
32%
Manganese
0.873mg
1.53mg
29%
Protein
12.49g
0g
25%
Vitamin B6
0.348mg
0.67mg
25%
Monounsaturated fat
8.194g
0.032g
20%
Saturated fat
4.127g
0.018g
19%
Fiber
4.5g
0g
18%
Calcium
33mg
205mg
17%
Folate
65µg
0µg
16%
Fructose
12.79g
16%
Vitamin B5
0.174mg
0.804mg
13%
Vitamin B3
2.856mg
0.93mg
12%
Selenium
11.5µg
17.8µg
11%
Calories
469kcal
290kcal
9%
Sodium
195mg
37mg
7%
Vitamin B2
0.088mg
0.002mg
7%
Magnesium
218mg
242mg
6%
Carbs
60.49g
74.73g
5%
Iron
4.53mg
4.72mg
2%
Vitamin B12
0.04µg
0µg
2%
Choline
13.3mg
2%
Protein per 100 calories
2.7g
0g
N/A
Calories per 10 g protein
376kcal
N/A
Weight per 100 calories
21g
34g
N/A
Unsaturated / Saturated Fat ratio
4
4.6
N/A
Vitamin C
0.1mg
0mg
0%
Net carbs
55.99g
74.73g
N/A
Sugar
74.72g
N/A
Macronutrient Comparison
Macronutrient breakdown side-by-side comparison
2
12%
22%
60%
4%
2%
Protein:
12.49 g
Fats:
21.52 g
Carbs:
60.49 g
Water:
3.67 g
Other:
1.83 g
3
75%
22%
3%
Protein:
0 g
Fats:
0.1 g
Carbs:
74.73 g
Water:
21.87 g
Other:
3.3 g
Contains
more
Protein Protein
+∞%
Contains
more
Fats Fats
+21420%
Contains
more
Carbs Carbs
+23.5%
Contains
more
Water Water
+495.9%
Contains
more
Other Other
+80.3%
Fat Type Comparison
Fat type breakdown side-by-side comparison
2
20%
39%
41%
Saturated fat:
Sat. Fat
4.127 g
Monounsaturated fat:
Mono. Fat
8.194 g
Polyunsaturated fat:
Poly. Fat
8.481 g
1
18%
32%
50%
Saturated fat:
Sat. Fat
0.018 g
Monounsaturated fat:
Mono. Fat
0.032 g
Polyunsaturated fat:
Poly. Fat
0.05 g
Contains
more
Mono. Fat Monounsaturated fat
+25506.3%
Contains
more
Poly. Fat Polyunsaturated fat
+16862%
Contains
less
Sat. Fat Saturated fat
-99.6%