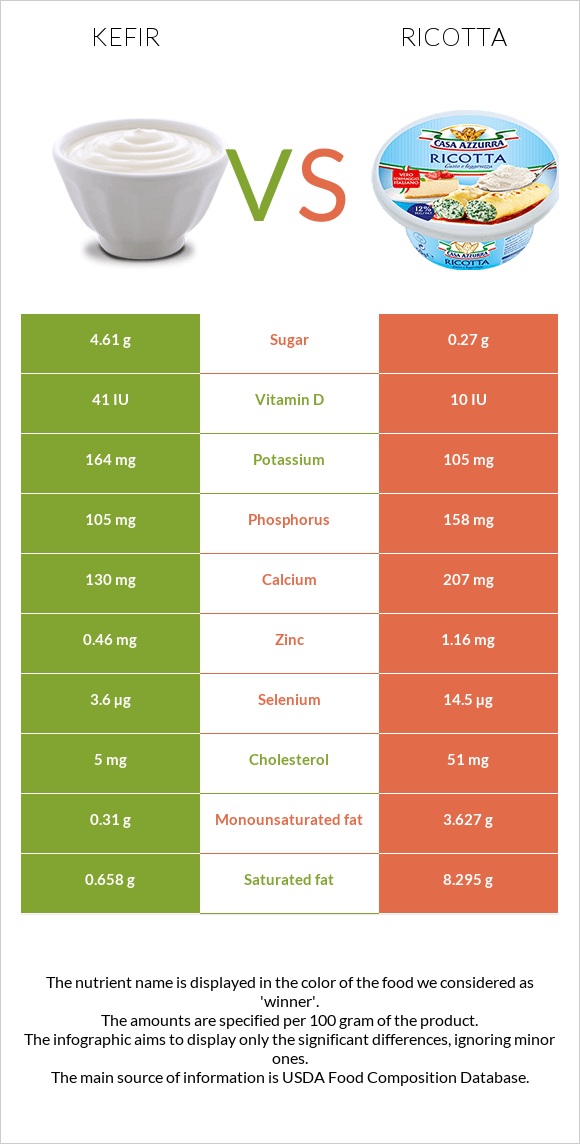
A recap on the differences between kefir and ricotta Ricotta is higher than kefir in selenium, calcium, phosphorus, zinc, and monounsaturated fat. Ricotta covers your daily saturated fat needs 38% more than kefir. Kefir contains 17 times more sugar than ricotta. While kefir contains 4.61g of sugar, ricotta contains only 0.27g. Food varieties used in this article are Kefir, lowfat, plain, LIFEWAY and Cheese, ricotta, whole milk .
Infographic
Mineral Comparison
Mineral comparison score is based on the number of minerals by which one or the other food is richer. The "coverage" charts below show how much of the daily needs can be covered by 300 grams of the food.
2
100 g
300 g
Magnesium
Magnesium
Calcium
Calcium
Potassium
Potassium
Iron
Iron
Copper
Copper
Zinc
Zinc
Phosphorus
Phosphorus
Sodium
Sodium
Manganese
Manganese
Selenium
Selenium
8.6%
39%
14%
1.5%
3%
13%
45%
5.2%
0.65%
20%
7
100 g
300 g
1 small cup - 55g 0.5 cup - 124g 1 cup - 246g
Magnesium
Magnesium
Calcium
Calcium
Potassium
Potassium
Iron
Iron
Copper
Copper
Zinc
Zinc
Phosphorus
Phosphorus
Sodium
Sodium
Manganese
Manganese
Selenium
Selenium
7.9%
62%
9.3%
14%
7%
32%
68%
11%
0.78%
79%
Vitamin Comparison
Vitamin comparison score is based on the number of vitamins by which one or the other food is richer. The "coverage" charts below show how much of the daily needs can be covered by 300 grams of the food.
7
100 g
300 g
Vitamin C
Vit. C
Vitamin D
Vit. D
Vitamin A
Vit. A
Vitamin E
Vit. E
Vitamin B1
Vit. B1
Vitamin B2
Vit. B2
Vitamin B3
Vit. B3
Vitamin B5
Vit. B5
Vitamin B6
Vit. B6
Vitamin B12
Vit. B12
Vitamin K
Vit. K
Folate
Folate
0.67%
15%
57%
0.4%
7.5%
31%
2.8%
23%
13%
36%
0.25%
9.8%
4
100 g
300 g
1 small cup - 55g 0.5 cup - 124g 1 cup - 246g
Vitamin C
Vit. C
Vitamin D
Vit. D
Vitamin A
Vit. A
Vitamin E
Vit. E
Vitamin B1
Vit. B1
Vitamin B2
Vit. B2
Vitamin B3
Vit. B3
Vitamin B5
Vit. B5
Vitamin B6
Vit. B6
Vitamin B12
Vit. B12
Vitamin K
Vit. K
Folate
Folate
0%
3%
40%
2.2%
3.3%
45%
2%
13%
9.9%
43%
2.8%
9%
All nutrients comparison - raw data values
Nutrient
DV% diff.
Saturated fat
0.658g
8.295g
35%
Selenium
3.6µg
14.5µg
20%
Fats
0.93g
12.98g
19%
Protein
3.79g
11.26g
15%
Cholesterol
5mg
51mg
15%
Calcium
130mg
207mg
8%
Phosphorus
105mg
158mg
8%
Monounsaturated fat
0.31g
3.627g
8%
Calories
41kcal
174kcal
7%
Zinc
0.46mg
1.16mg
6%
Vitamin A
171µg
120µg
6%
Vitamin B2
0.135mg
0.195mg
5%
Vitamin D*
41 IU
10 IU
4%
Vitamin D
1µg
0.2µg
4%
Iron
0.04mg
0.38mg
4%
Vitamin B5
0.385mg
0.213mg
3%
Potassium
164mg
105mg
2%
Sodium
40mg
84mg
2%
Vitamin B12
0.29µg
0.34µg
2%
Polyunsaturated fat
0.053g
0.385g
2%
Copper
0.009mg
0.021mg
1%
Vitamin E
0.02mg
0.11mg
1%
Vitamin B1
0.03mg
0.013mg
1%
Vitamin B6
0.058mg
0.043mg
1%
Vitamin K
0.1µg
1.1µg
1%
Protein per 100 calories
9.2g
6.5g
N/A
Calories per 10 g protein
108kcal
155kcal
N/A
Weight per 100 calories
244g
57g
N/A
Unsaturated / Saturated Fat ratio
0.55
0.48
N/A
Vitamin C
0.2mg
0mg
0%
Net carbs
4.48g
3.04g
N/A
Carbs
4.48g
3.04g
0%
Magnesium
12mg
11mg
0%
Sugar
4.61g
0.27g
N/A
Manganese
0.005mg
0.006mg
0%
Vitamin B3
0.15mg
0.104mg
0%
Folate
13µg
12µg
0%
Trans fat
0.037g
N/A
Choline
15.2mg
17.5mg
0%
Tryptophan
0.125mg
0%
Threonine
0.517mg
0%
Isoleucine
0.589mg
0%
Leucine
1.221mg
0%
Lysine
1.338mg
0%
Methionine
0.281mg
0%
Phenylalanine
0.556mg
0%
Valine
0.692mg
0%
Histidine
0.459mg
0%
Omega-3 - ALA
0.006g
N/A
Omega-3 - DPA
0.001g
0g
N/A
Omega-6 - Dihomo-gamma-linoleic acid
0.002g
N/A
Omega-6 - Linoleic acid
0.029g
N/A
Macronutrient Comparison
Macronutrient breakdown side-by-side comparison
2
4%
4%
90%
Protein:
3.79 g
Fats:
0.93 g
Carbs:
4.48 g
Water:
90.07 g
Other:
0.73 g
3
11%
13%
3%
72%
Protein:
11.26 g
Fats:
12.98 g
Carbs:
3.04 g
Water:
71.7 g
Other:
1.02 g
Contains
more
Carbs Carbs
+47.4%
Contains
more
Water Water
+25.6%
Contains
more
Protein Protein
+197.1%
Contains
more
Fats Fats
+1295.7%
Contains
more
Other Other
+39.7%
Fat Type Comparison
Fat type breakdown side-by-side comparison
1
64%
30%
5%
Saturated fat:
Sat. Fat
0.658 g
Monounsaturated fat:
Mono. Fat
0.31 g
Polyunsaturated fat:
Poly. Fat
0.053 g
2
67%
29%
3%
Saturated fat:
Sat. Fat
8.295 g
Monounsaturated fat:
Mono. Fat
3.627 g
Polyunsaturated fat:
Poly. Fat
0.385 g
Contains
less
Sat. Fat Saturated fat
-92.1%
Contains
more
Mono. Fat Monounsaturated fat
+1070%
Contains
more
Poly. Fat Polyunsaturated fat
+626.4%