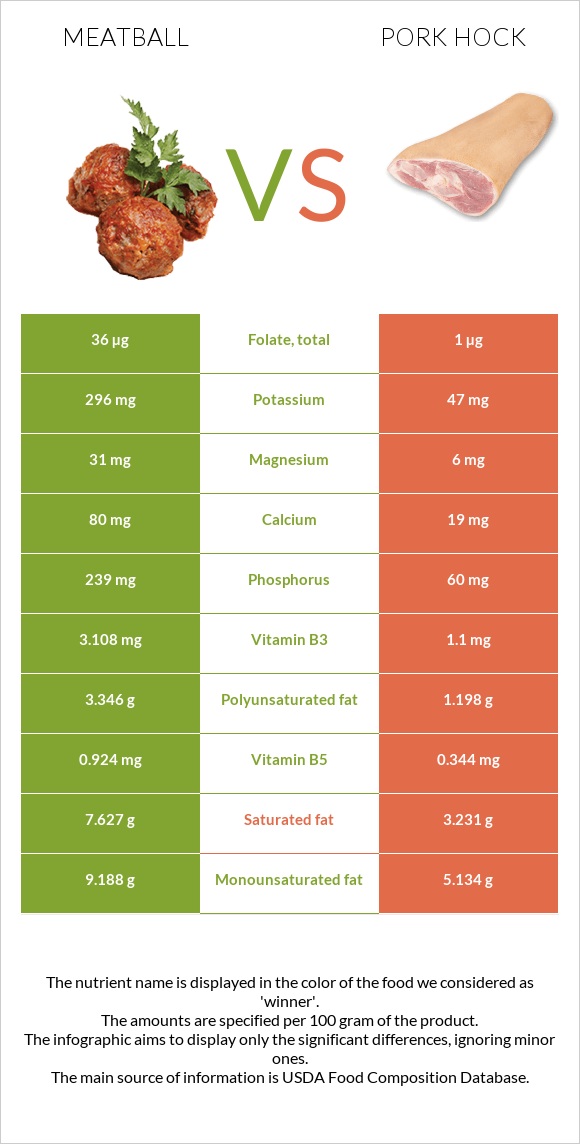
Significant differences between meatball and pork hock Meatball has more phosphorus, vitamin B12, vitamin B3, vitamin B2, vitamin B5, manganese, and vitamin B6; however, pork hock is richer in selenium. Meatball covers your daily phosphorus needs 26% more than pork hock. Pork hock has 13 times less manganese than meatball. Meatball has 0.282mg of manganese, while pork hock has 0.022mg. Pork hock contains less saturated fat. Specific food types used in this comparison are Meatballs, frozen, Italian style and Pork, pickled pork hocks .
Infographic
Mineral Comparison
Mineral comparison score is based on the number of minerals by which one or the other food is richer. The "coverage" charts below show how much of the daily needs can be covered by 300 grams of the food.
8
100 g
300 g
3 pieces - 56g 3 oz - 85g
Magnesium
Magnesium
Calcium
Calcium
Potassium
Potassium
Iron
Iron
Copper
Copper
Zinc
Zinc
Phosphorus
Phosphorus
Sodium
Sodium
Manganese
Manganese
Selenium
Selenium
22%
24%
26%
66%
41%
45%
102%
87%
37%
83%
2
100 g
300 g
3 oz - 117g
Magnesium
Magnesium
Calcium
Calcium
Potassium
Potassium
Iron
Iron
Copper
Copper
Zinc
Zinc
Phosphorus
Phosphorus
Sodium
Sodium
Manganese
Manganese
Selenium
Selenium
4.3%
5.7%
4.1%
43%
27%
65%
26%
137%
2.9%
143%
Vitamin Comparison
Vitamin comparison score is based on the number of vitamins by which one or the other food is richer. The "coverage" charts below show how much of the daily needs can be covered by 300 grams of the food.
10
100 g
300 g
3 pieces - 56g 3 oz - 85g
Vitamin C
Vit. C
Vitamin D
Vit. D
Vitamin A
Vit. A
Vitamin E
Vit. E
Vitamin B1
Vit. B1
Vitamin B2
Vit. B2
Vitamin B3
Vit. B3
Vitamin B5
Vit. B5
Vitamin B6
Vit. B6
Vitamin B12
Vit. B12
Vitamin K
Vit. K
Folate
Folate
0%
1.5%
7.3%
8.4%
34%
53%
58%
55%
47%
125%
21%
27%
0
100 g
300 g
3 oz - 117g
Vitamin C
Vit. C
Vitamin D
Vit. D
Vitamin A
Vit. A
Vitamin E
Vit. E
Vitamin B1
Vit. B1
Vitamin B2
Vit. B2
Vitamin B3
Vit. B3
Vitamin B5
Vit. B5
Vitamin B6
Vit. B6
Vitamin B12
Vit. B12
Vitamin K
Vit. K
Folate
Folate
0%
0%
7.7%
3.4%
20%
16%
21%
21%
15%
64%
0%
0.75%
All nutrients comparison - raw data values
Nutrient
DV% diff.
Phosphorus
239mg
60mg
26%
Selenium
15.3µg
26.3µg
20%
Vitamin B12
1µg
0.51µg
20%
Saturated fat
7.627g
3.231g
20%
Fats
22.21g
10.54g
18%
Sodium
666mg
1050mg
17%
Polyunsaturated fat
3.346g
1.198g
14%
Vitamin B3
3.108mg
1.1mg
13%
Vitamin B2
0.23mg
0.068mg
12%
Vitamin B5
0.924mg
0.344mg
12%
Manganese
0.282mg
0.022mg
11%
Vitamin B6
0.202mg
0.064mg
11%
Monounsaturated fat
9.188g
5.134g
10%
Protein
14.4g
19.11g
9%
Fiber
2.3g
0g
9%
Folate
36µg
1µg
9%
Cholesterol
66mg
89mg
8%
Iron
1.77mg
1.14mg
8%
Choline
45.2mg
8%
Potassium
296mg
47mg
7%
Zinc
1.66mg
2.38mg
7%
Vitamin K
8.2µg
0µg
7%
Calories
286kcal
171kcal
6%
Magnesium
31mg
6mg
6%
Calcium
80mg
19mg
6%
Copper
0.123mg
0.082mg
5%
Vitamin B1
0.136mg
0.08mg
5%
Carbs
8.06g
0g
3%
Vitamin E
0.42mg
0.17mg
2%
Vitamin D
0.1µg
1%
Starch
2.25g
1%
Protein per 100 calories
5g
11g
N/A
Calories per 10 g protein
199kcal
89kcal
N/A
Weight per 100 calories
35g
58g
N/A
Unsaturated / Saturated Fat ratio
1.6
2
N/A
Net carbs
5.76g
0g
N/A
Vitamin D*
2 IU
0%
Sugar
3.47g
0g
N/A
Vitamin A
22µg
23µg
0%
Trans fat
0.577g
0.113g
N/A
Tryptophan
0.038mg
0%
Threonine
0.516mg
0%
Isoleucine
0.325mg
0%
Leucine
0.841mg
0%
Lysine
0.822mg
0%
Methionine
0.211mg
0%
Phenylalanine
0.554mg
0%
Valine
0.478mg
0%
Histidine
0.211mg
0%
Fructose
0.21g
0g
0%
Omega-3 - EPA
0.005g
0g
N/A
Omega-3 - DHA
0.004g
0g
N/A
Omega-3 - ALA
0.163g
0.042g
N/A
Omega-3 - DPA
0.013g
0g
N/A
Omega-3 - Eicosatrienoic acid
0.012g
N/A
Omega-6 - Gamma-linoleic acid
0.005g
0g
N/A
Omega-6 - Dihomo-gamma-linoleic acid
0.022g
N/A
Omega-6 - Eicosadienoic acid
0.07g
0.045g
N/A
Omega-6 - Linoleic acid
2.815g
0.986g
N/A
Macronutrient Comparison
Macronutrient breakdown side-by-side comparison
2
14%
22%
8%
54%
Protein:
14.4 g
Fats:
22.21 g
Carbs:
8.06 g
Water:
53.67 g
Other:
1.66 g
3
19%
11%
68%
2%
Protein:
19.11 g
Fats:
10.54 g
Carbs:
0 g
Water:
68.02 g
Other:
2.33 g
Contains
more
Fats Fats
+110.7%
Contains
more
Carbs Carbs
+∞%
Contains
more
Protein Protein
+32.7%
Contains
more
Water Water
+26.7%
Contains
more
Other Other
+40.4%
Fat Type Comparison
Fat type breakdown side-by-side comparison
2
38%
46%
17%
Saturated fat:
Sat. Fat
7.627 g
Monounsaturated fat:
Mono. Fat
9.188 g
Polyunsaturated fat:
Poly. Fat
3.346 g
1
34%
54%
13%
Saturated fat:
Sat. Fat
3.231 g
Monounsaturated fat:
Mono. Fat
5.134 g
Polyunsaturated fat:
Poly. Fat
1.198 g
Contains
more
Mono. Fat Monounsaturated fat
+79%
Contains
more
Poly. Fat Polyunsaturated fat
+179.3%
Contains
less
Sat. Fat Saturated fat
-57.6%