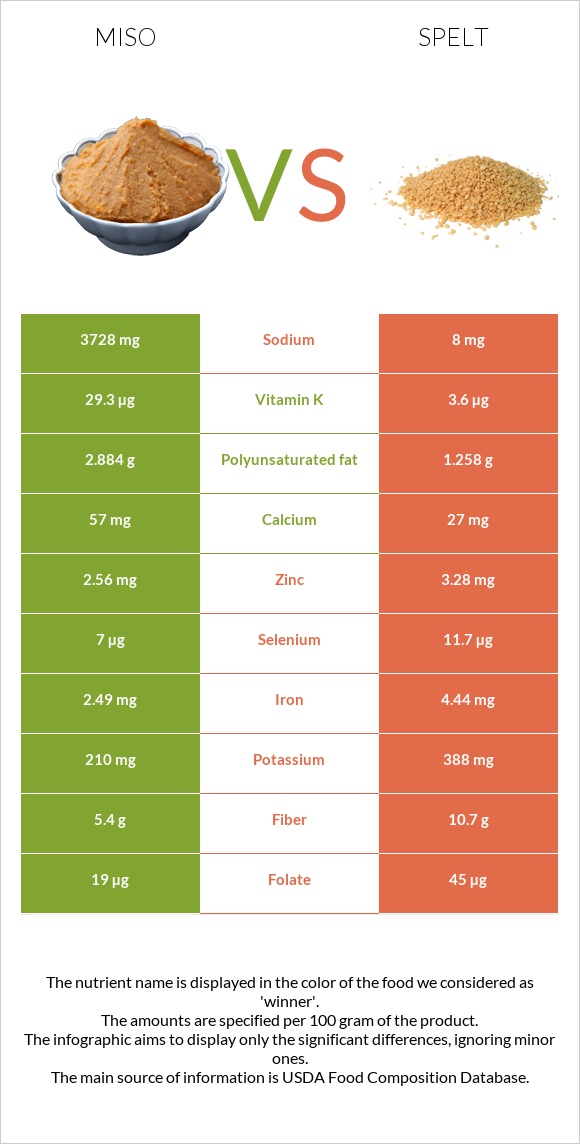
Important differences between miso and spelt Miso has more vitamin K; however, spelt is richer in manganese, vitamin B3, phosphorus, iron, vitamin B1, fiber, magnesium, and vitamin B5. Miso's daily need coverage for sodium is 162% more. Miso contains 8 times more vitamin K than spelt. Miso contains 29.3µg of vitamin K, while spelt contains 3.6µg. Spelt contains less sodium. The food varieties used in the comparison are Miso and Spelt, uncooked .
Infographic
Mineral Comparison
Mineral comparison score is based on the number of minerals by which one or the other food is richer. The "coverage" charts below show how much of the daily needs can be covered by 300 grams of the food.
1
100 g
300 g
1 tbsp - 17g 1 cup - 275g
Magnesium
Magnesium
Calcium
Calcium
Potassium
Potassium
Iron
Iron
Copper
Copper
Zinc
Zinc
Phosphorus
Phosphorus
Sodium
Sodium
Manganese
Manganese
Selenium
Selenium
34%
17%
19%
93%
140%
70%
68%
486%
112%
38%
9
100 g
300 g
1 cup - 174g
Magnesium
Magnesium
Calcium
Calcium
Potassium
Potassium
Iron
Iron
Copper
Copper
Zinc
Zinc
Phosphorus
Phosphorus
Sodium
Sodium
Manganese
Manganese
Selenium
Selenium
97%
8.1%
34%
167%
170%
89%
172%
1%
389%
64%
Vitamin Comparison
Vitamin comparison score is based on the number of vitamins by which one or the other food is richer. The "coverage" charts below show how much of the daily needs can be covered by 300 grams of the food.
4
100 g
300 g
1 tbsp - 17g 1 cup - 275g
Vitamin C
Vit. C
Vitamin D
Vit. D
Vitamin A
Vit. A
Vitamin E
Vit. E
Vitamin B1
Vit. B1
Vitamin B2
Vit. B2
Vitamin B3
Vit. B3
Vitamin B5
Vit. B5
Vitamin B6
Vit. B6
Vitamin B12
Vit. B12
Vitamin K
Vit. K
Folate
Folate
0%
0%
1.3%
0.2%
25%
54%
17%
20%
46%
10%
73%
14%
6
100 g
300 g
1 cup - 174g
Vitamin C
Vit. C
Vitamin D
Vit. D
Vitamin A
Vit. A
Vitamin E
Vit. E
Vitamin B1
Vit. B1
Vitamin B2
Vit. B2
Vitamin B3
Vit. B3
Vitamin B5
Vit. B5
Vitamin B6
Vit. B6
Vitamin B12
Vit. B12
Vitamin K
Vit. K
Folate
Folate
0%
0%
0%
16%
91%
26%
128%
64%
53%
0%
9%
34%
All nutrients comparison - raw data values
Nutrient
DV% diff.
Sodium
3728mg
8mg
162%
Manganese
0.859mg
2.983mg
92%
Vitamin B3
0.906mg
6.843mg
37%
Phosphorus
159mg
401mg
35%
Iron
2.49mg
4.44mg
24%
Starch
53.92g
22%
Vitamin B1
0.098mg
0.364mg
22%
Magnesium
48mg
136mg
21%
Fiber
5.4g
10.7g
21%
Vitamin K
29.3µg
3.6µg
21%
Carbs
25.37g
70.19g
15%
Vitamin B5
0.337mg
1.068mg
15%
Choline
72.2mg
13%
Polyunsaturated fat
2.884g
1.258g
11%
Copper
0.42mg
0.511mg
10%
Selenium
7µg
11.7µg
9%
Vitamin B2
0.233mg
0.113mg
9%
Calories
198kcal
338kcal
7%
Zinc
2.56mg
3.28mg
7%
Folate
19µg
45µg
7%
Fructose
6g
0.24g
7%
Fats
6.01g
2.43g
6%
Potassium
210mg
388mg
5%
Vitamin E
0.01mg
0.79mg
5%
Protein
12.79g
14.57g
4%
Calcium
57mg
27mg
3%
Vitamin B12
0.08µg
0µg
3%
Saturated fat
1.025g
0.406g
3%
Vitamin B6
0.199mg
0.23mg
2%
Monounsaturated fat
1.118g
0.445g
2%
Protein per 100 calories
6.5g
4.3g
N/A
Calories per 10 g protein
155kcal
232kcal
N/A
Weight per 100 calories
51g
30g
N/A
Unsaturated / Saturated Fat ratio
3.9
4.2
N/A
Net carbs
19.97g
59.49g
N/A
Sugar
6.2g
6.82g
N/A
Vitamin A
4µg
0µg
0%
Tryptophan
0.155mg
0.132mg
0%
Threonine
0.479mg
0.443mg
0%
Isoleucine
0.508mg
0.552mg
0%
Leucine
0.82mg
1.07mg
0%
Lysine
0.478mg
0.409mg
0%
Methionine
0.129mg
0.258mg
0%
Phenylalanine
0.486mg
0.737mg
0%
Valine
0.547mg
0.681mg
0%
Histidine
0.243mg
0.36mg
0%
Omega-3 - ALA
0.065g
N/A
Macronutrient Comparison
Macronutrient breakdown side-by-side comparison
3
13%
6%
25%
43%
13%
Protein:
12.79 g
Fats:
6.01 g
Carbs:
25.37 g
Water:
43.02 g
Other:
12.81 g
2
15%
2%
70%
11%
2%
Protein:
14.57 g
Fats:
2.43 g
Carbs:
70.19 g
Water:
11.02 g
Other:
1.79 g
Contains
more
Fats Fats
+147.3%
Contains
more
Water Water
+290.4%
Contains
more
Other Other
+615.6%
Contains
more
Protein Protein
+13.9%
Contains
more
Carbs Carbs
+176.7%
Fat Type Comparison
Fat type breakdown side-by-side comparison
2
20%
22%
57%
Saturated fat:
Sat. Fat
1.025 g
Monounsaturated fat:
Mono. Fat
1.118 g
Polyunsaturated fat:
Poly. Fat
2.884 g
1
19%
21%
60%
Saturated fat:
Sat. Fat
0.406 g
Monounsaturated fat:
Mono. Fat
0.445 g
Polyunsaturated fat:
Poly. Fat
1.258 g
Contains
more
Mono. Fat Monounsaturated fat
+151.2%
Contains
more
Poly. Fat Polyunsaturated fat
+129.3%
Contains
less
Sat. Fat Saturated fat
-60.4%
Carbohydrate type comparison
Carbohydrate type breakdown side-by-side comparison
1
97%
3%
Starch:
0 g
Sucrose:
0 g
Glucose:
0 g
Fructose:
6 g
Lactose:
0 g
Maltose:
0.2 g
Galactose:
0 g
4
89%
8%
Starch:
53.92 g
Sucrose:
0.59 g
Glucose:
0.84 g
Fructose:
0.24 g
Lactose:
0 g
Maltose:
5.15 g
Galactose:
0 g
Contains
more
Fructose Fructose
+2400%
Contains
more
Starch Starch
+∞%
Contains
more
Sucrose Sucrose
+∞%
Contains
more
Glucose Glucose
+∞%
Contains
more
Maltose Maltose
+2475%
~equal in
Lactose
~0g
~equal in
Galactose
~0g