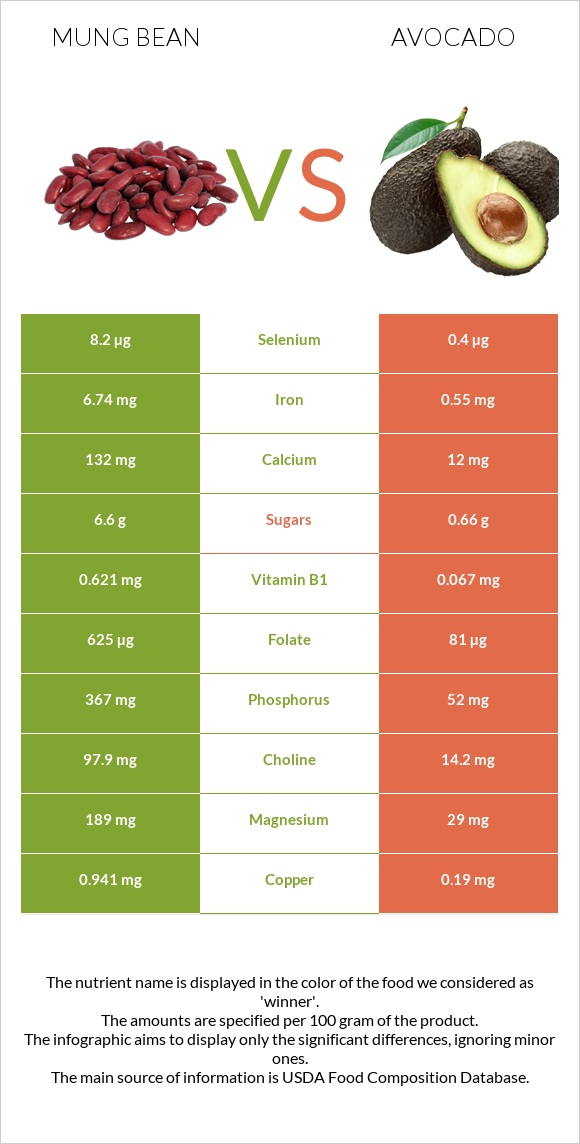
What are the differences between mung beans and avocados? Mung beans are richer than avocados in folate, copper, iron, vitamin B1, phosphorus, manganese, fiber, magnesium, potassium, and zinc. Mung beans' daily need coverage for folate is 136% more. Mung beans have 12 times more iron than avocados. While mung beans have 6.74mg of iron, avocados have only 0.55mg. We used Mung beans, mature seeds, raw and Avocados, raw, all commercial varieties types in this article.
Infographic
Mineral Comparison
Mineral comparison score is based on the number of minerals by which one or the other food is richer. The "coverage" charts below show how much of the daily needs can be covered by 300 grams of the food.
9
100 g
300 g
1 tbsp - 13g 1 cup - 207g
Magnesium
Magnesium
Calcium
Calcium
Potassium
Potassium
Iron
Iron
Copper
Copper
Zinc
Zinc
Phosphorus
Phosphorus
Sodium
Sodium
Manganese
Manganese
Selenium
Selenium
135%
40%
110%
253%
314%
73%
157%
2%
135%
45%
1
100 g
300 g
1 cup, sliced - 146g 1 cup, cubes - 150g 1 avocado, NS as to Florida or California - 201g 1 cup, pureed - 230g
Magnesium
Magnesium
Calcium
Calcium
Potassium
Potassium
Iron
Iron
Copper
Copper
Zinc
Zinc
Phosphorus
Phosphorus
Sodium
Sodium
Manganese
Manganese
Selenium
Selenium
21%
3.6%
43%
21%
63%
17%
22%
0.91%
19%
2.2%
Vitamin Comparison
Vitamin comparison score is based on the number of vitamins by which one or the other food is richer. The "coverage" charts below show how much of the daily needs can be covered by 300 grams of the food.
6
100 g
300 g
1 tbsp - 13g 1 cup - 207g
Vitamin C
Vit. C
Vitamin D
Vit. D
Vitamin A
Vit. A
Vitamin E
Vit. E
Vitamin B1
Vit. B1
Vitamin B2
Vit. B2
Vitamin B3
Vit. B3
Vitamin B5
Vit. B5
Vitamin B6
Vit. B6
Vitamin B12
Vit. B12
Vitamin K
Vit. K
Folate
Folate
16%
0%
2%
10%
155%
54%
42%
115%
88%
0%
23%
469%
4
100 g
300 g
1 cup, sliced - 146g 1 cup, cubes - 150g 1 avocado, NS as to Florida or California - 201g 1 cup, pureed - 230g
Vitamin C
Vit. C
Vitamin D
Vit. D
Vitamin A
Vit. A
Vitamin E
Vit. E
Vitamin B1
Vit. B1
Vitamin B2
Vit. B2
Vitamin B3
Vit. B3
Vitamin B5
Vit. B5
Vitamin B6
Vit. B6
Vitamin B12
Vit. B12
Vitamin K
Vit. K
Folate
Folate
33%
0%
2.3%
41%
17%
30%
33%
83%
59%
0%
53%
61%
All nutrients comparison - raw data values
Nutrient
DV% diff.
Folate
625µg
81µg
136%
Copper
0.941mg
0.19mg
83%
Iron
6.74mg
0.55mg
77%
Vitamin B1
0.621mg
0.067mg
46%
Phosphorus
367mg
52mg
45%
Protein
23.86g
2g
44%
Manganese
1.035mg
0.142mg
39%
Magnesium
189mg
29mg
38%
Fiber
16.3g
6.7g
38%
Monounsaturated fat
0.161g
9.799g
24%
Potassium
1246mg
485mg
22%
Fats
1.15g
14.66g
21%
Zinc
2.68mg
0.64mg
19%
Carbs
62.62g
8.53g
18%
Choline
97.9mg
14.2mg
15%
Selenium
8.2µg
0.4µg
14%
Calcium
132mg
12mg
12%
Vitamin E
0.51mg
2.07mg
10%
Vitamin B5
1.91mg
1.389mg
10%
Vitamin B6
0.382mg
0.257mg
10%
Vitamin K
9µg
21µg
10%
Polyunsaturated fat
0.384g
1.816g
10%
Calories
347kcal
160kcal
9%
Vitamin B2
0.233mg
0.13mg
8%
Saturated fat
0.348g
2.126g
8%
Vitamin C
4.8mg
10mg
6%
Vitamin B3
2.251mg
1.738mg
3%
Protein per 100 calories
6.9g
1.3g
N/A
Calories per 10 g protein
145kcal
800kcal
N/A
Weight per 100 calories
29g
63g
N/A
Unsaturated / Saturated Fat ratio
1.6
5.5
N/A
Net carbs
46.32g
1.83g
N/A
Sugar
6.6g
0.66g
N/A
Starch
0.11g
0%
Sodium
15mg
7mg
0%
Vitamin A
6µg
7µg
0%
Tryptophan
0.26mg
0.025mg
0%
Threonine
0.782mg
0.073mg
0%
Isoleucine
1.008mg
0.084mg
0%
Leucine
1.847mg
0.143mg
0%
Lysine
1.664mg
0.132mg
0%
Methionine
0.286mg
0.038mg
0%
Phenylalanine
1.443mg
0.097mg
0%
Valine
1.237mg
0.107mg
0%
Histidine
0.695mg
0.049mg
0%
Fructose
0.12g
0%
Omega-3 - ALA
0.111g
N/A
Omega-6 - Gamma-linoleic acid
0.015g
N/A
Macronutrient Comparison
Macronutrient breakdown side-by-side comparison
3
24%
63%
9%
3%
Protein:
23.86 g
Fats:
1.15 g
Carbs:
62.62 g
Water:
9.05 g
Other:
3.32 g
2
2%
15%
9%
73%
Protein:
2 g
Fats:
14.66 g
Carbs:
8.53 g
Water:
73.23 g
Other:
1.58 g
Contains
more
Protein Protein
+1093%
Contains
more
Carbs Carbs
+634.1%
Contains
more
Other Other
+110.1%
Contains
more
Fats Fats
+1174.8%
Contains
more
Water Water
+709.2%
Fat Type Comparison
Fat type breakdown side-by-side comparison
1
39%
18%
43%
Saturated fat:
Sat. Fat
0.348 g
Monounsaturated fat:
Mono. Fat
0.161 g
Polyunsaturated fat:
Poly. Fat
0.384 g
2
15%
71%
13%
Saturated fat:
Sat. Fat
2.126 g
Monounsaturated fat:
Mono. Fat
9.799 g
Polyunsaturated fat:
Poly. Fat
1.816 g
Contains
less
Sat. Fat Saturated fat
-83.6%
Contains
more
Mono. Fat Monounsaturated fat
+5986.3%
Contains
more
Poly. Fat Polyunsaturated fat
+372.9%