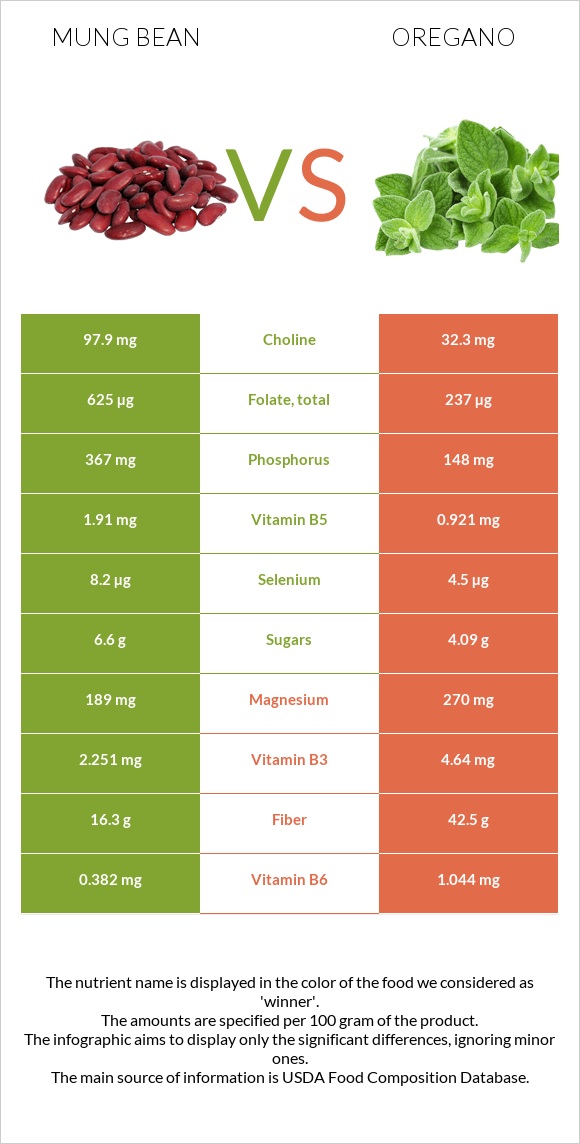
What are the differences between mung beans and oregano? Mung beans are higher in folate, vitamin B1, and copper, yet oregano is higher in vitamin K, iron, manganese, calcium, vitamin E, fiber, and vitamin B6. Oregano's daily need coverage for vitamin K is 511% more. Mung beans have 4 times more vitamin B1 than oregano. While mung beans have 0.621mg of vitamin B1, oregano has only 0.177mg. The glycemic index of oregano is lower. We used Mung beans, mature seeds, raw and Spices, oregano, dried types in this article.
Infographic
Mineral Comparison
Mineral comparison score is based on the number of minerals by which one or the other food is richer. The "coverage" charts below show how much of the daily needs can be covered by 300 grams of the food.
4
100 g
300 g
1 tbsp - 13g 1 cup - 207g
Magnesium
Magnesium
Calcium
Calcium
Potassium
Potassium
Iron
Iron
Copper
Copper
Zinc
Zinc
Phosphorus
Phosphorus
Sodium
Sodium
Manganese
Manganese
Selenium
Selenium
135%
40%
110%
253%
314%
73%
157%
2%
135%
45%
4
100 g
300 g
0.25 tsp - 0.5g 1 tsp, ground - 1.8g
Magnesium
Magnesium
Calcium
Calcium
Potassium
Potassium
Iron
Iron
Copper
Copper
Zinc
Zinc
Phosphorus
Phosphorus
Sodium
Sodium
Manganese
Manganese
Selenium
Selenium
193%
479%
111%
1380%
211%
73%
63%
3.3%
651%
25%
Vitamin Comparison
Vitamin comparison score is based on the number of vitamins by which one or the other food is richer. The "coverage" charts below show how much of the daily needs can be covered by 300 grams of the food.
4
100 g
300 g
1 tbsp - 13g 1 cup - 207g
Vitamin C
Vit. C
Vitamin D
Vit. D
Vitamin A
Vit. A
Vitamin E
Vit. E
Vitamin B1
Vit. B1
Vitamin B2
Vit. B2
Vitamin B3
Vit. B3
Vitamin B5
Vit. B5
Vitamin B6
Vit. B6
Vitamin B12
Vit. B12
Vitamin K
Vit. K
Folate
Folate
16%
0%
2%
10%
155%
54%
42%
115%
88%
0%
23%
469%
6
100 g
300 g
0.25 tsp - 0.5g 1 tsp, ground - 1.8g
Vitamin C
Vit. C
Vitamin D
Vit. D
Vitamin A
Vit. A
Vitamin E
Vit. E
Vitamin B1
Vit. B1
Vitamin B2
Vit. B2
Vitamin B3
Vit. B3
Vitamin B5
Vit. B5
Vitamin B6
Vit. B6
Vitamin B12
Vit. B12
Vitamin K
Vit. K
Folate
Folate
7.7%
0%
28%
365%
44%
122%
87%
55%
241%
0%
1554%
178%
All nutrients comparison - raw data values
Nutrient
DV% diff.
Vitamin K
9µg
621.7µg
511%
Iron
6.74mg
36.8mg
376%
Manganese
1.035mg
4.99mg
172%
Calcium
132mg
1597mg
147%
Vitamin E
0.51mg
18.26mg
118%
Fiber
16.3g
42.5g
105%
Folate
625µg
237µg
97%
Vitamin B6
0.382mg
1.044mg
51%
Vitamin B1
0.621mg
0.177mg
37%
Copper
0.941mg
0.633mg
34%
Phosphorus
367mg
148mg
31%
Protein
23.86g
9g
30%
Vitamin B2
0.233mg
0.528mg
23%
Vitamin B5
1.91mg
0.921mg
20%
Magnesium
189mg
270mg
19%
Vitamin B3
2.251mg
4.64mg
15%
Choline
97.9mg
32.3mg
12%
Vitamin A
6µg
85µg
9%
Selenium
8.2µg
4.5µg
7%
Polyunsaturated fat
0.384g
1.369g
7%
Fats
1.15g
4.28g
5%
Saturated fat
0.348g
1.551g
5%
Calories
347kcal
265kcal
4%
Vitamin C
4.8mg
2.3mg
3%
Carbs
62.62g
68.92g
2%
Monounsaturated fat
0.161g
0.716g
1%
Fructose
1.13g
1%
Protein per 100 calories
6.9g
3.4g
N/A
Calories per 10 g protein
145kcal
294kcal
N/A
Weight per 100 calories
29g
38g
N/A
Unsaturated / Saturated Fat ratio
1.6
1.3
N/A
Net carbs
46.32g
26.42g
N/A
Potassium
1246mg
1260mg
0%
Sugar
6.6g
4.09g
N/A
Zinc
2.68mg
2.69mg
0%
Sodium
15mg
25mg
0%
Tryptophan
0.26mg
0.203mg
0%
Threonine
0.782mg
0.322mg
0%
Isoleucine
1.008mg
0.441mg
0%
Leucine
1.847mg
0.78mg
0%
Lysine
1.664mg
0.5mg
0%
Methionine
0.286mg
0.127mg
0%
Phenylalanine
1.443mg
0.449mg
0%
Valine
1.237mg
0.585mg
0%
Histidine
0.695mg
0.144mg
0%
Omega-3 - ALA
0.621g
N/A
Macronutrient Comparison
Macronutrient breakdown side-by-side comparison
1
24%
63%
9%
3%
Protein:
23.86 g
Fats:
1.15 g
Carbs:
62.62 g
Water:
9.05 g
Other:
3.32 g
4
9%
4%
69%
10%
8%
Protein:
9 g
Fats:
4.28 g
Carbs:
68.92 g
Water:
9.93 g
Other:
7.87 g
Contains
more
Protein Protein
+165.1%
Contains
more
Fats Fats
+272.2%
Contains
more
Carbs Carbs
+10.1%
Contains
more
Other Other
+137%
Fat Type Comparison
Fat type breakdown side-by-side comparison
1
39%
18%
43%
Saturated fat:
Sat. Fat
0.348 g
Monounsaturated fat:
Mono. Fat
0.161 g
Polyunsaturated fat:
Poly. Fat
0.384 g
2
43%
20%
38%
Saturated fat:
Sat. Fat
1.551 g
Monounsaturated fat:
Mono. Fat
0.716 g
Polyunsaturated fat:
Poly. Fat
1.369 g
Contains
less
Sat. Fat Saturated fat
-77.6%
Contains
more
Mono. Fat Monounsaturated fat
+344.7%
Contains
more
Poly. Fat Polyunsaturated fat
+256.5%