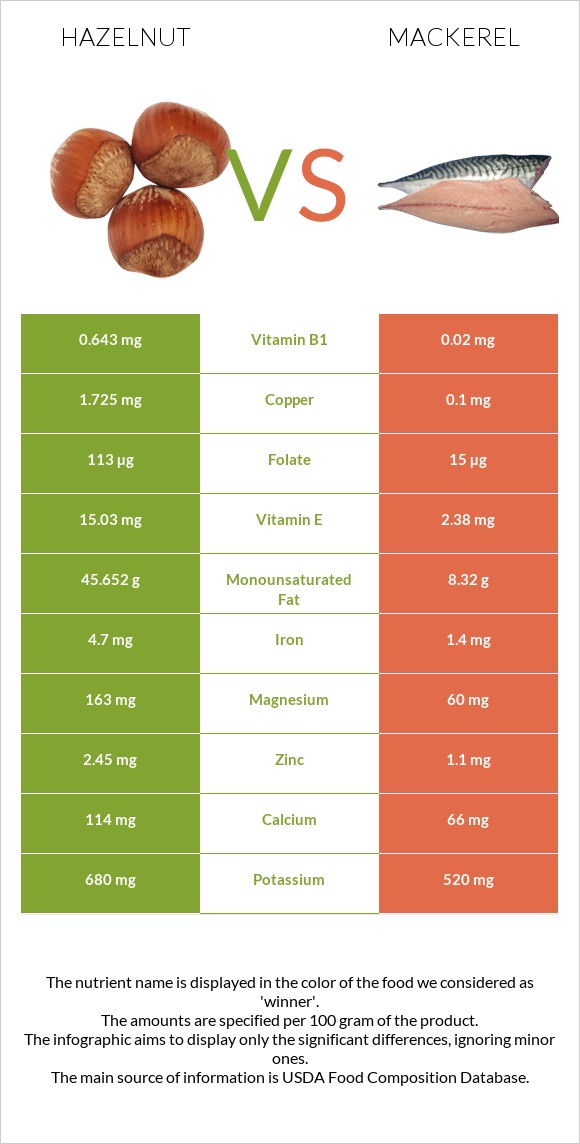
Significant differences between hazelnut and mackerel Hazelnut is richer in copper, vitamin E, vitamin B1, iron, and fiber, while mackerel is higher in vitamin B12, selenium, and vitamin D*. Mackerel covers your daily vitamin B12 needs 500% more than hazelnut. Hazelnut has a higher glycemic index (15) than mackerel (0). Specific food types used in this comparison are Nuts, hazelnuts or filberts and Fish, mackerel, salted .
Infographic
Mineral Comparison
Mineral comparison score is based on the number of minerals by which one or the other food is richer. The "coverage" charts below show how much of the daily needs can be covered by 300 grams of the food.
9
100 g
300 g
10 nuts - 14g 1 oz (21 whole kernels) - 28.35g 1 cup, ground - 75g 1 cup, chopped - 115g 1 cup, whole - 135g
Magnesium
Magnesium
Calcium
Calcium
Potassium
Potassium
Iron
Iron
Copper
Copper
Zinc
Zinc
Phosphorus
Phosphorus
Sodium
Sodium
Manganese
Manganese
Selenium
Selenium
116%
34%
60%
176%
575%
67%
124%
0%
805%
13%
1
100 g
300 g
1 cubic inch, boneless - 17g 1 piece (5-1/2" x 1-1/2" x 1/2") - 80g 1 cup, cooked - 136g
Magnesium
Magnesium
Calcium
Calcium
Potassium
Potassium
Iron
Iron
Copper
Copper
Zinc
Zinc
Phosphorus
Phosphorus
Sodium
Sodium
Manganese
Manganese
Selenium
Selenium
43%
20%
46%
53%
33%
30%
109%
580%
0%
400%
Vitamin Comparison
Vitamin comparison score is based on the number of vitamins by which one or the other food is richer. The "coverage" charts below show how much of the daily needs can be covered by 300 grams of the food.
7
100 g
300 g
10 nuts - 14g 1 oz (21 whole kernels) - 28.35g 1 cup, ground - 75g 1 cup, chopped - 115g 1 cup, whole - 135g
Vitamin C
Vit. C
Vitamin D
Vit. D
Vitamin A
Vit. A
Vitamin E
Vit. E
Vitamin B1
Vit. B1
Vitamin B2
Vit. B2
Vitamin B3
Vit. B3
Vitamin B5
Vit. B5
Vitamin B6
Vit. B6
Vitamin B12
Vit. B12
Vitamin K
Vit. K
Folate
Folate
21%
0%
0.33%
301%
161%
26%
34%
55%
130%
0%
36%
85%
5
100 g
300 g
1 cubic inch, boneless - 17g 1 piece (5-1/2" x 1-1/2" x 1/2") - 80g 1 cup, cooked - 136g
Vitamin C
Vit. C
Vitamin D
Vit. D
Vitamin A
Vit. A
Vitamin E
Vit. E
Vitamin B1
Vit. B1
Vitamin B2
Vit. B2
Vitamin B3
Vit. B3
Vitamin B5
Vit. B5
Vitamin B6
Vit. B6
Vitamin B12
Vit. B12
Vitamin K
Vit. K
Folate
Folate
0%
378%
16%
48%
5%
44%
62%
0%
95%
1500%
20%
11%
All nutrients comparison - raw data values
Nutrient
DV% diff.
Vitamin B12
0µg
12µg
500%
Manganese
6.175mg
268%
Sodium
0mg
4450mg
193%
Copper
1.725mg
0.1mg
181%
Selenium
2.4µg
73.4µg
129%
Vitamin D*
0 IU
1006 IU
126%
Vitamin D
0µg
25.2µg
126%
Monounsaturated fat
45.652g
8.32g
93%
Vitamin E
15.03mg
2.38mg
84%
Fats
60.75g
25.1g
55%
Vitamin B1
0.643mg
0.02mg
52%
Iron
4.7mg
1.4mg
41%
Fiber
9.7g
0g
39%
Cholesterol
0mg
95mg
32%
Magnesium
163mg
60mg
25%
Folate
113µg
15µg
25%
Vitamin B5
0.918mg
18%
Calories
628kcal
305kcal
16%
Zinc
2.45mg
1.1mg
12%
Vitamin B6
0.563mg
0.41mg
12%
Saturated fat
4.464g
7.148g
12%
Polyunsaturated fat
7.92g
6.21g
11%
Choline
45.6mg
101.6mg
10%
Vitamin B3
1.8mg
3.3mg
9%
Protein
14.95g
18.5g
7%
Vitamin C
6.3mg
0mg
7%
Carbs
16.7g
0g
6%
Vitamin B2
0.113mg
0.19mg
6%
Calcium
114mg
66mg
5%
Potassium
680mg
520mg
5%
Phosphorus
290mg
254mg
5%
Vitamin A
1µg
47µg
5%
Vitamin K
14.2µg
7.8µg
5%
Protein per 100 calories
2.4g
6.1g
N/A
Calories per 10 g protein
420kcal
165kcal
N/A
Weight per 100 calories
16g
33g
N/A
Unsaturated / Saturated Fat ratio
12
2
N/A
Net carbs
7g
0g
N/A
Sugar
4.34g
0g
N/A
Starch
0.48g
0%
Tryptophan
0.193mg
0%
Threonine
0.497mg
0%
Isoleucine
0.545mg
0%
Leucine
1.063mg
0%
Lysine
0.42mg
0%
Methionine
0.221mg
0%
Phenylalanine
0.663mg
0%
Valine
0.701mg
0%
Histidine
0.432mg
0%
Fructose
0.07g
0%
Omega-3 - EPA
0g
1.619g
N/A
Omega-3 - DHA
0g
2.965g
N/A
Omega-3 - DPA
0g
0.391g
N/A
Macronutrient Comparison
Macronutrient breakdown side-by-side comparison
2
15%
61%
17%
5%
2%
Protein:
14.95 g
Fats:
60.75 g
Carbs:
16.7 g
Water:
5.31 g
Other:
2.29 g
3
19%
25%
43%
13%
Protein:
18.5 g
Fats:
25.1 g
Carbs:
0 g
Water:
43 g
Other:
13.4 g
Contains
more
Fats Fats
+142%
Contains
more
Carbs Carbs
+∞%
Contains
more
Protein Protein
+23.7%
Contains
more
Water Water
+709.8%
Contains
more
Other Other
+485.2%
Fat Type Comparison
Fat type breakdown side-by-side comparison
3
8%
79%
14%
Saturated fat:
Sat. Fat
4.464 g
Monounsaturated fat:
Mono. Fat
45.652 g
Polyunsaturated fat:
Poly. Fat
7.92 g
0
33%
38%
29%
Saturated fat:
Sat. Fat
7.148 g
Monounsaturated fat:
Mono. Fat
8.32 g
Polyunsaturated fat:
Poly. Fat
6.21 g
Contains
less
Sat. Fat Saturated fat
-37.5%
Contains
more
Mono. Fat Monounsaturated fat
+448.7%
Contains
more
Poly. Fat Polyunsaturated fat
+27.5%