Pear vs. Apple — In-Depth Nutrition Comparison
Compare
A recap on the differences between pear and apples
- Apples have less copper.
Food varieties used in this article are Pears, raw and Apples, raw, with skin.
Infographic
Infographic link
Mineral Comparison
Mineral comparison score is based on the number of minerals by which one or the other food is richer. The "coverage" charts below show how much of the daily needs can be covered by 300 grams of the food.
| Contains more MagnesiumMagnesium | +40% |
| Contains more CalciumCalcium | +50% |
| Contains more IronIron | +50% |
| Contains more CopperCopper | +203.7% |
| Contains more ZincZinc | +150% |
| Contains more ManganeseManganese | +37.1% |
| Contains more SeleniumSelenium | +∞% |
Vitamin Comparison
Vitamin comparison score is based on the number of vitamins by which one or the other food is richer. The "coverage" charts below show how much of the daily needs can be covered by 300 grams of the food.
| Contains more Vitamin B3Vitamin B3 | +76.9% |
| Contains more Vitamin KVitamin K | +100% |
| Contains more FolateFolate | +133.3% |
| Contains more Vitamin AVitamin A | +200% |
| Contains more Vitamin EVitamin E | +50% |
| Contains more Vitamin B1Vitamin B1 | +41.7% |
| Contains more Vitamin B5Vitamin B5 | +24.5% |
| Contains more Vitamin B6Vitamin B6 | +41.4% |
All nutrients comparison - raw data values
| Nutrient |  |
 |
DV% diff. |
| Copper | 0.082mg | 0.027mg | 6% |
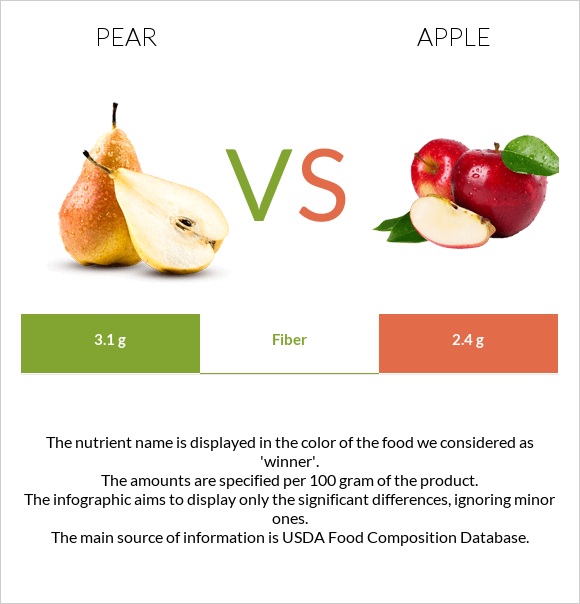
| Fiber | 3.1g | 2.4g | 3% |
| Vitamin K | 4.4µg | 2.2µg | 2% |
| Iron | 0.18mg | 0.12mg | 1% |
| Zinc | 0.1mg | 0.04mg | 1% |
| Manganese | 0.048mg | 0.035mg | 1% |
| Vitamin B6 | 0.029mg | 0.041mg | 1% |
| Folate | 7µg | 3µg | 1% |
| Fructose | 6.42g | 5.9g | 1% |
| Calories | 57kcal | 52kcal | 0% |
| Protein | 0.36g | 0.26g | 0% |
| Weight per 100 calories | 175g | 192g | N/A |
| Fats | 0.14g | 0.17g | 0% |
| Vitamin C | 4.3mg | 4.6mg | 0% |
| Net carbs | 12.13g | 11.41g | N/A |
| Carbs | 15.23g | 13.81g | 0% |
| Magnesium | 7mg | 5mg | 0% |
| Calcium | 9mg | 6mg | 0% |
| Potassium | 116mg | 107mg | 0% |
| Sugar | 9.75g | 10.39g | N/A |
| Starch | 0.05g | 0% | |
| Phosphorus | 12mg | 11mg | 0% |
| Sodium | 1mg | 1mg | 0% |
| Vitamin A | 1µg | 3µg | 0% |
| Vitamin E | 0.12mg | 0.18mg | 0% |
| Selenium | 0.1µg | 0µg | 0% |
| Vitamin B1 | 0.012mg | 0.017mg | 0% |
| Vitamin B2 | 0.026mg | 0.026mg | 0% |
| Vitamin B3 | 0.161mg | 0.091mg | 0% |
| Vitamin B5 | 0.049mg | 0.061mg | 0% |
| Choline | 5.1mg | 3.4mg | 0% |
| Saturated fat | 0.022g | 0.028g | 0% |
| Monounsaturated fat | 0.084g | 0.007g | 0% |
| Polyunsaturated fat | 0.094g | 0.051g | 0% |
| Tryptophan | 0.002mg | 0.001mg | 0% |
| Threonine | 0.011mg | 0.006mg | 0% |
| Isoleucine | 0.011mg | 0.006mg | 0% |
| Leucine | 0.019mg | 0.013mg | 0% |
| Lysine | 0.017mg | 0.012mg | 0% |
| Methionine | 0.002mg | 0.001mg | 0% |
| Phenylalanine | 0.011mg | 0.006mg | 0% |
| Valine | 0.017mg | 0.012mg | 0% |
| Histidine | 0.002mg | 0.005mg | 0% |
Macronutrient Comparison
Macronutrient breakdown side-by-side comparison
| Contains more ProteinProtein | +38.5% |
| Contains more OtherOther | +55% |
| Contains more FatsFats | +21.4% |
~equal in
Carbs
~13.81g
~equal in
Water
~85.56g
Fat Type Comparison
Fat type breakdown side-by-side comparison
| Contains less Sat. FatSaturated fat | -21.4% |
| Contains more Mono. FatMonounsaturated fat | +1100% |
| Contains more Poly. FatPolyunsaturated fat | +84.3% |
Carbohydrate type comparison
Carbohydrate type breakdown side-by-side comparison
| Contains more StarchStarch | +∞% |
| Contains more SucroseSucrose | +191.5% |
~equal in
Glucose
~2.43g
~equal in
Fructose
~5.9g
~equal in
Lactose
~0g
~equal in
Maltose
~0g
~equal in
Galactose
~0g


