
Peppers, sweet, green, freeze-dried vs. Bell pepper — In-Depth Nutrition Comparison
Compare
What are the differences between peppers, sweet, green, freeze-dried and bell peppers?
- Peppers, sweet, green, freeze-dried is richer than bell peppers in vitamin C, vitamin B6, copper, iron, vitamin B1, vitamin K, vitamin B2, potassium, fiber, and manganese.
- Peppers, sweet, green, freeze-dried's daily need coverage for vitamin C is 2022% more.
- Peppers, sweet, green, freeze-dried has 43 times more vitamin B2 than bell peppers. While peppers, sweet, green, freeze-dried has 1.2mg of vitamin B2, bell peppers have only 0.028mg.
We used Peppers, sweet, green, freeze-dried and Peppers, sweet, green, raw types in this article.
Infographic
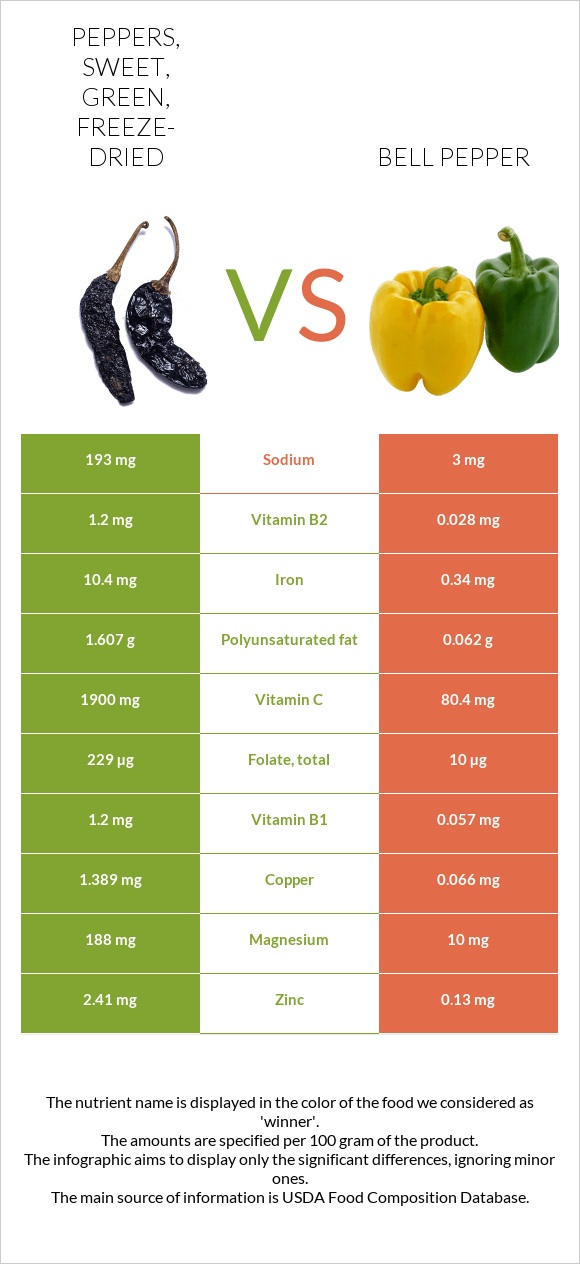
Infographic link
Mineral Comparison
The mineral comparison score is based on which food has a more favorable amount of each mineral. The �coverage� charts below show how much of the daily mineral needs are covered by the selected amount of each food.
| Contains more MagnesiumMagnesium | +1780% |
| Contains more CalciumCalcium | +1240% |
| Contains more PotassiumPotassium | +1711.4% |
| Contains more IronIron | +2958.8% |
| Contains more CopperCopper | +2004.5% |
| Contains more ZincZinc | +1753.8% |
| Contains more PhosphorusPhosphorus | +1535% |
| Contains more ManganeseManganese | +1454.9% |
| Contains more SeleniumSelenium | +∞% |
| Contains less SodiumSodium | -98.4% |
Vitamin Comparison
The vitamin comparison score is based on the number of vitamins in which one food is richer than the other. The �coverage� charts below show how much of the daily vitamin needs are covered by the selected amount of each food.
| Contains more Vitamin CVitamin C | +2263.2% |
| Contains more Vitamin AVitamin A | +1466.7% |
| Contains more Vitamin EVitamin E | +981.1% |
| Contains more Vitamin B1Vitamin B1 | +2005.3% |
| Contains more Vitamin B2Vitamin B2 | +4185.7% |
| Contains more Vitamin B3Vitamin B3 | +1441.7% |
| Contains more Vitamin B5Vitamin B5 | +392.9% |
| Contains more Vitamin B6Vitamin B6 | +892.4% |
| Contains more Vitamin KVitamin K | +1502.7% |
| Contains more FolateFolate | +2190% |
All nutrients comparison - raw data values
| Nutrient |  |
 |
DV% diff. |
| Vitamin C | 1900mg | 80.4mg | 2022% |
| Vitamin B6 | 2.223mg | 0.224mg | 154% |
| Copper | 1.389mg | 0.066mg | 147% |
| Iron | 10.4mg | 0.34mg | 126% |
| Vitamin B1 | 1.2mg | 0.057mg | 95% |
| Vitamin K | 118.6µg | 7.4µg | 93% |
| Vitamin B2 | 1.2mg | 0.028mg | 90% |
| Potassium | 3170mg | 175mg | 88% |
| Fiber | 21.3g | 1.7g | 78% |
| Manganese | 1.897mg | 0.122mg | 77% |
| Folate | 229µg | 10µg | 55% |
| Phosphorus | 327mg | 20mg | 44% |
| Vitamin B3 | 7.4mg | 0.48mg | 43% |
| Magnesium | 188mg | 10mg | 42% |
| Protein | 17.9g | 0.86g | 34% |
| Vitamin A | 282µg | 18µg | 29% |
| Vitamin E | 4mg | 0.37mg | 24% |
| Carbs | 68.7g | 4.64g | 21% |
| Zinc | 2.41mg | 0.13mg | 21% |
| Calories | 314kcal | 20kcal | 15% |
| Choline | 89mg | 5.5mg | 15% |
| Calcium | 134mg | 10mg | 12% |
| Polyunsaturated fat | 1.607g | 0.062g | 10% |
| Sodium | 193mg | 3mg | 8% |
| Vitamin B5 | 0.488mg | 0.099mg | 8% |
| Selenium | 3.7µg | 0µg | 7% |
| Fats | 3g | 0.17g | 4% |
| Saturated fat | 0.447g | 0.058g | 2% |
| Fructose | 1.12g | 1% | |
| Protein per 100 calories | 5.7g | 4.3g | N/A |
| Calories per 10 g protein | 175kcal | 233kcal | N/A |
| Weight per 100 calories | 32g | 500g | N/A |
| Unsaturated / Saturated Fat ratio | 4 | 1.2 | N/A |
| Net carbs | 47.4g | 2.94g | N/A |
| Sugar | 38.48g | 2.4g | N/A |
| Monounsaturated fat | 0.202g | 0.008g | 0% |
| Tryptophan | 0.229mg | 0.012mg | 0% |
| Threonine | 0.659mg | 0.036mg | 0% |
| Isoleucine | 0.579mg | 0.024mg | 0% |
| Leucine | 0.937mg | 0.036mg | 0% |
| Lysine | 0.796mg | 0.039mg | 0% |
| Methionine | 0.215mg | 0.007mg | 0% |
| Phenylalanine | 0.553mg | 0.092mg | 0% |
| Valine | 0.756mg | 0.036mg | 0% |
| Histidine | 0.364mg | 0.01mg | 0% |
Macronutrient Comparison
Macronutrient breakdown side-by-side comparison
Protein:
17.9 g
Fats:
3 g
Carbs:
68.7 g
Water:
2 g
Other:
8.4 g
Protein:
0.86 g
Fats:
0.17 g
Carbs:
4.64 g
Water:
93.89 g
Other:
0.44 g
| Contains more ProteinProtein | +1981.4% |
| Contains more FatsFats | +1664.7% |
| Contains more CarbsCarbs | +1380.6% |
| Contains more WaterWater | +4594.5% |
Fat Type Comparison
Fat type breakdown side-by-side comparison
Saturated fat:
Sat. Fat
0.447 g
Monounsaturated fat:
Mono. Fat
0.202 g
Polyunsaturated fat:
Poly. Fat
1.607 g
Saturated fat:
Sat. Fat
0.058 g
Monounsaturated fat:
Mono. Fat
0.008 g
Polyunsaturated fat:
Poly. Fat
0.062 g
| Contains more Mono. FatMonounsaturated fat | +2425% |
| Contains more Poly. FatPolyunsaturated fat | +2491.9% |
| Contains less Sat. FatSaturated fat | -87% |