Bell pepper nutrition: calories, carbs, GI, protein, fiber, fats
Top nutrition facts for Bell pepper
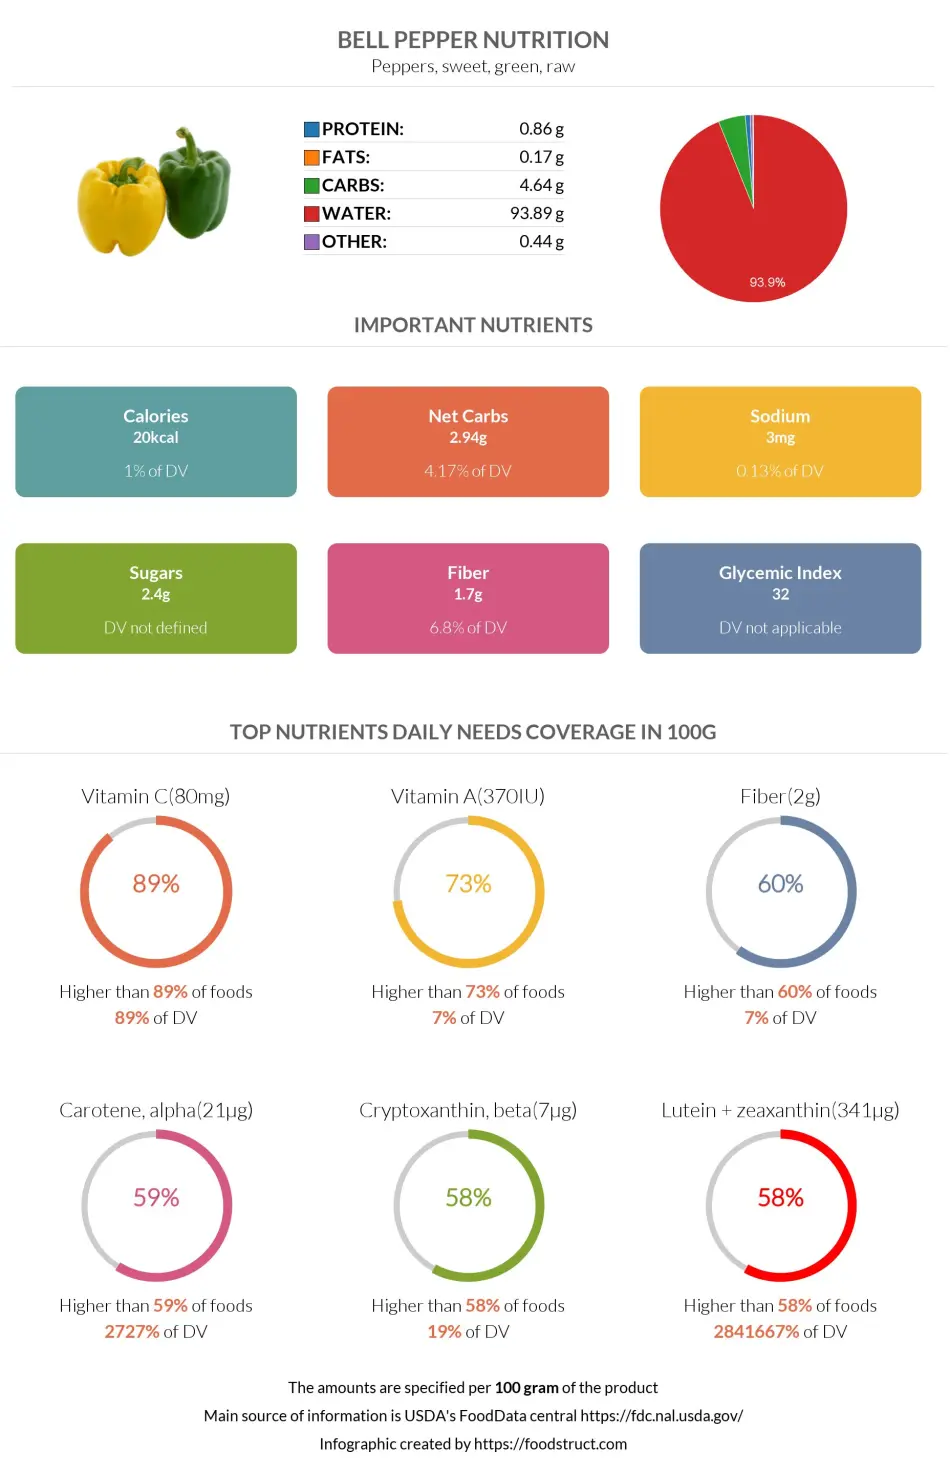
| Calories ⓘ Calories for selected serving | 20 kcal |
| Glycemic index ⓘ Gi values are taken from various scientific sources. GI values less than 55 are considered as low. Values above 70 are considered as high. | 32 (low) |
| Glycemic load ⓘ Glycemic Load (GL) is a metric that measures both the quality (Glycemic Index) and quantity of carbohydrates in a specific serving of food to estimate its impact on blood sugar levels. It is calculated as: (GI × Carbs in grams) / 100. | 1 (low) |
| Net carbs ⓘ Net Carbs = Total Carbohydrates – Fiber – Sugar Alcohols | 3 g |
| Default serving size ⓘ Serving sizes are mostly taken from FDA's Reference Amounts Customarily Consumed (RACCs) | 1 medium (approx 2-3/4" long, 2-1/2" dia) (119 g) |
| Acidity (Based on PRAL) ⓘ PRAL (Potential renal acid load) is calculated using a formula. On the PRAL scale the higher the positive value, the more is the acidifying effect on the body. The lower the negative value, the higher the alkalinity of the food. 0 is neutral. | -2.9 (alkaline) |
| Oxalates | 10 mg ⓘ https://www.researchgate.net/publication/280642641 |
Bell Pepper Carbs
Green pepper is not particularly dense in nutrients, as it consists of 94% water. The remaining 6% are nutrients, predominantly carbs. 100 grams of green pepper contains 4.64g of carbs, covering 2% of the daily need (in the case of a 2000-calorie diet).
Macronutrients chart
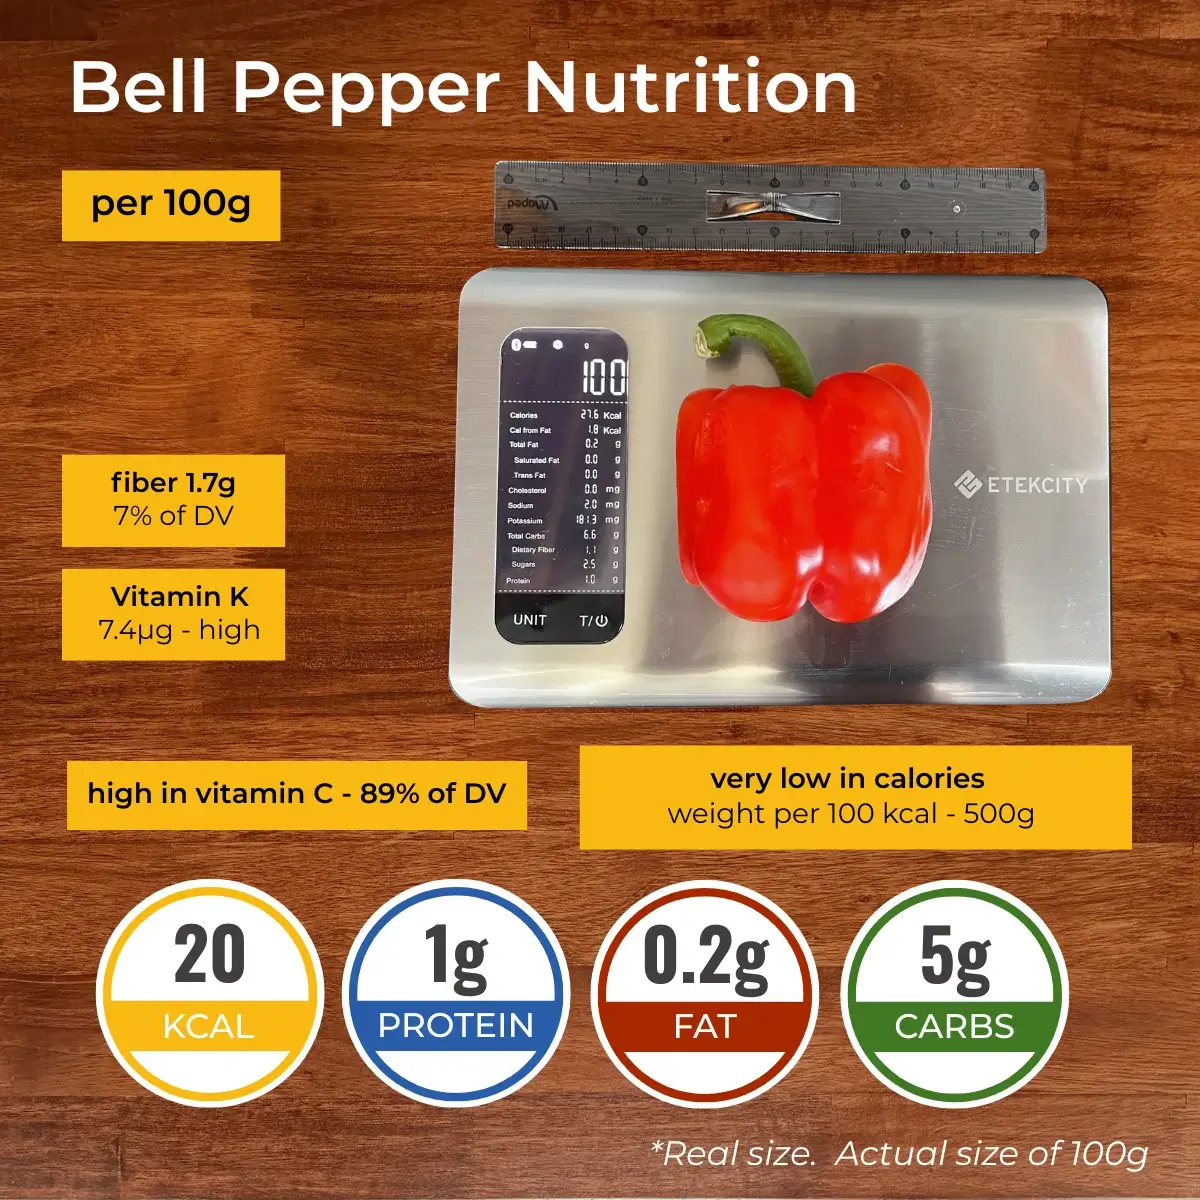
What Do 27.6 Calories or 100 Grams of Bell Pepper Look Like?

Calorie content may vary depending on the pepper’s color, size, and ripeness. The picture shows a raw red bell pepper.
The picture above features what 27.6 calories or 100 grams of bell pepper look like, giving a visual reference for their weight and calorie content. 100 grams of bell pepper is a little less than one medium pepper, as one medium bell pepper weighs about 119 grams. A typical serving size is one medium bell pepper (119 g), which provides 33 calories.
Carbs Per Serving Size
The average serving size of bell pepper is one medium pepper (~119g), containing 5.52g of carbs.
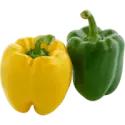
Different Types
Bell peppers can be yellow and red as well. These two types are relatively higher in carbs.
A hundred grams of yellow and red peppers contain 6.32g and 6.03g of carbs, respectively.
Carbohydrate Type Breakdown
Most of the pepper carbs that break down into simple sugars are glucose and fructose.
Carbohydrate type breakdown
Bell Pepper Net Carbs
As previously mentioned, 100g of green pepper contains 4.64g of carbs: 2.94g of net carbs and 1.7g of dietary fiber.
Green pepper is the best choice for low-carb diets, such as keto, as it contains the least net carbs, compared to yellow (5.42g of net carbs) and red (3.93g) peppers.
Nevertheless, for a high-fiber diet, the best choices are red pepper (2.1g of dietary fiber), green (1.7g), and yellow (0.9g) peppers.
Soluble or Insoluble Fiber
65% of green pepper’s dietary fiber is insoluble (1).
Insoluble fiber helps with constipation by making the food move faster through the digestive tract and increasing stool bulk.
Fiber content ratio for Bell pepper
References

Bell pepper calories (kcal)
| Calories for different serving sizes of bell pepper | Calories | Weight |
|---|---|---|
| Calories in 100 grams | 20 | |
| Calories in 1 tbsp | 2 | 9.3 g |
| Calories in 10 strips | 5 | 27 g |
| Calories in 1 small | 15 | 74 g |
| Calories in 1 cup, sliced | 18 | 92 g |
| Calories in 1 cup, chopped | 30 | 149 g |
| Calories for different varieties of bell pepper | Calories | Weight |
|---|---|---|
| Peppers, sweet, green, raw (this food) | 20 | 100 g |
| Peppers, sweet, red, frozen, chopped, boiled, drained, without salt | 16 | 100 g |
| Peppers, sweet, red, frozen, chopped, boiled, drained, with salt | 16 | 100 g |
| Peppers, sweet, red, canned, solids and liquids | 18 | 100 g |
| Peppers, sweet, red, frozen, chopped, unprepared | 20 | 100 g |
| Peppers, sweet, red, cooked, boiled, drained, with salt | 26 | 100 g |
| Peppers, sweet, red, cooked, boiled, drained, without salt | 28 | 100 g |
| Peppers, sweet, red, raw | 31 | 100 g |
| Peppers, sweet, green, sauteed | 127 | 100 g |
| Peppers, sweet, red, freeze-dried | 314 | 100 g |
Extra Nutrition facts for Bell pepper
| Protein per 100 calories ⓘ Shows how many grams of protein you get from 100 calories of this food, calculated as (protein in g ÷ calories) × 100. | 4.3 g |
| Calories per 10 g protein ⓘ Shows how many calories you need to eat from this food to get 10 g of protein, calculated as (calories ÷ protein in g) × 10. | 233 kcal |
| Weight per 100 calories ⓘ Shows how many grams of this food equal 100 kcal—higher grams mean a larger portion for the same calories. | 500 g |
Bell pepper Glycemic index (GI)
Bell pepper Glycemic load (GL)
Mineral coverage chart
Mineral chart - relative view
Vitamin coverage chart
Vitamin chart - relative view
Protein quality breakdown
Fat type information
All nutrients for Bell pepper per 100g
| Nutrient | Value | DV% | In TOP % of foods | Comparison |
| Vitamin A | 18µg | 2% | 27% | |
| Calories | 20kcal | 1% | 98% |
2.4 times less than Orange
|
| Weight per 100 calories | 500g | N/A | 3% | |
| Protein | 0.86g | 2% | 87% |
3.3 times less than Broccoli
|
| Protein per 100 calories | 4.3g | N/A | 50% | |
| Calories per 10 g protein | 233kcal | N/A | 47% | |
| Fats | 0.17g | 0% | 90% |
195.9 times less than Cheese
|
| Vitamin C | 80mg | 89% | 2% |
1.5 times more than Lemon
|
| Net carbs | 2.9g | N/A | 63% |
18.4 times less than Chocolate
|
| Carbs | 4.6g | 2% | 62% |
6.1 times less than Rice
|
| Cholesterol | 0mg | 0% | 100% |
N/A
|
| Vitamin D* | 0 IU | 0% | 100% |
N/A
|
| Vitamin D | 0µg | 0% | 100% |
N/A
|
| Magnesium | 10mg | 2% | 76% |
14 times less than Almonds
|
| Calcium | 10mg | 1% | 73% |
12.5 times less than Milk
|
| Potassium | 175mg | 5% | 61% |
1.2 times more than Cucumber
|
| Iron | 0.34mg | 4% | 82% |
7.6 times less than Beef broiled
|
| Sugar | 2.4g | N/A | 37% |
3.7 times less than Coca-Cola
|
| Fiber | 1.7g | 7% | 34% |
1.4 times less than Orange
|
| Copper | 0.07mg | 7% | 58% |
2.2 times less than Shiitake
|
| Zinc | 0.13mg | 1% | 81% |
48.5 times less than Beef broiled
|
| Starch | 0g | 0% | 100% |
N/A
|
| Phosphorus | 20mg | 3% | 82% |
9.1 times less than Chicken meat
|
| Sodium | 3mg | 0% | 93% |
163.3 times less than White bread
|
| Vitamin E | 0.37mg | 2% | 31% |
3.9 times less than Kiwi
|
| Selenium | 0µg | 0% | 100% | |
| Manganese | 0.12mg | 5% | 35% | |
| Vitamin B1 | 0.06mg | 5% | 62% |
4.7 times less than Pea raw
|
| Vitamin B2 | 0.03mg | 2% | 81% |
4.6 times less than Avocado
|
| Vitamin B3 | 0.48mg | 3% | 72% |
19.9 times less than Turkey meat
|
| Vitamin B5 | 0.1mg | 2% | 64% |
11.4 times less than Sunflower seeds
|
| Vitamin B6 | 0.22mg | 17% | 37% |
1.9 times more than Oats
|
| Vitamin B12 | 0µg | 0% | 100% |
N/A
|
| Vitamin K | 7.4µg | 6% | 12% |
13.7 times less than Broccoli
|
| Trans fat | 0g | N/A | 100% |
N/A
|
| Folate | 10µg | 3% | 48% |
6.1 times less than Brussels sprouts
|
| Choline | 5.5mg | 1% | 46% | |
| Saturated fat | 0.06g | 0% | 81% |
101.6 times less than Beef broiled
|
| Monounsaturated fat | 0.01g | N/A | 86% |
1224.9 times less than Avocado
|
| Polyunsaturated fat | 0.06g | N/A | 81% |
760.9 times less than Walnut
|
| Tryptophan | 0.01mg | 0% | 53% |
25.4 times less than Chicken meat
|
| Threonine | 0.04mg | 0% | 54% |
20 times less than Beef broiled
|
| Isoleucine | 0.02mg | 0% | 56% |
38.1 times less than Salmon raw
|
| Leucine | 0.04mg | 0% | 56% |
67.5 times less than Tuna Bluefin
|
| Lysine | 0.04mg | 0% | 55% |
11.6 times less than Tofu
|
| Methionine | 0.01mg | 0% | 56% |
13.7 times less than Quinoa
|
| Phenylalanine | 0.09mg | 0% | 50% |
7.3 times less than Egg
|
| Valine | 0.04mg | 0% | 55% |
56.4 times less than Soybean raw
|
| Histidine | 0.01mg | 0% | 56% |
74.9 times less than Turkey meat
|
| Fructose | 1.1g | 1% | 6% |
5.3 times less than Apple
|
| Caffeine | 0mg | 0% | 100% | |
| Omega-3 - EPA | 0g | N/A | 100% |
N/A
|
| Omega-3 - DHA | 0g | N/A | 100% |
N/A
|
| Omega-3 - DPA | 0g | N/A | 100% |
N/A
|
| Omega-6 - Eicosadienoic acid | 0g | N/A | 100% |
Check out similar food or compare with current
NUTRITION FACTS LABEL
Serving Size ______________
Health checks
Bell pepper nutrition infographic
References
All the values for which the sources are not specified explicitly are taken from FDA’s Food Central. The exact link to the food presented on this page can be found below.