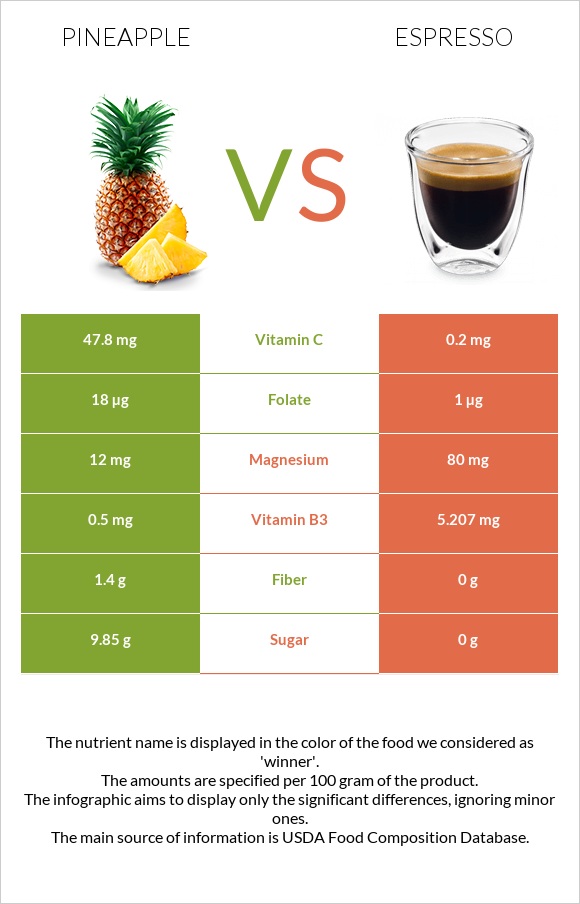
What are the main differences between pineapple and espresso? Pineapple is richer in vitamin C, manganese, vitamin B6, copper, vitamin B1, and fiber, yet espresso is richer in vitamin B3, magnesium, and vitamin B2. Pineapple's daily need coverage for vitamin C is 53% higher. Espresso has a lower glycemic index than pineapple. We used Pineapple, raw, all varieties and Beverages, coffee, brewed, espresso, restaurant-prepared types in this comparison.
Infographic
Mineral Comparison
Mineral comparison score is based on the number of minerals by which one or the other food is richer. The "coverage" charts below show how much of the daily needs can be covered by 300 grams of the food.
8
100 g
300 g
1 slice, thin (3-1/2" dia x 1/2" thick) - 56g 1 slice (3-1/2" dia x 3/4" thick) - 84g 1 cup, chunks - 165g 1 slice (4-2/3" dia x 3/4" thick) - 166g 1 fruit - 905g
Magnesium
Magnesium
Calcium
Calcium
Potassium
Potassium
Iron
Iron
Copper
Copper
Zinc
Zinc
Phosphorus
Phosphorus
Sodium
Sodium
Manganese
Manganese
Selenium
Selenium
8.6%
3.9%
9.6%
11%
37%
3.3%
3.4%
0.13%
121%
0.55%
1
100 g
300 g
1 fl oz - 29.6g
Magnesium
Magnesium
Calcium
Calcium
Potassium
Potassium
Iron
Iron
Copper
Copper
Zinc
Zinc
Phosphorus
Phosphorus
Sodium
Sodium
Manganese
Manganese
Selenium
Selenium
57%
0.6%
10%
4.9%
17%
1.4%
3%
1.8%
6.5%
0%
Vitamin Comparison
Vitamin comparison score is based on the number of vitamins by which one or the other food is richer. The "coverage" charts below show how much of the daily needs can be covered by 300 grams of the food.
8
100 g
300 g
1 slice, thin (3-1/2" dia x 1/2" thick) - 56g 1 slice (3-1/2" dia x 3/4" thick) - 84g 1 cup, chunks - 165g 1 slice (4-2/3" dia x 3/4" thick) - 166g 1 fruit - 905g
Vitamin C
Vit. C
Vitamin D
Vit. D
Vitamin A
Vit. A
Vitamin E
Vit. E
Vitamin B1
Vit. B1
Vitamin B2
Vit. B2
Vitamin B3
Vit. B3
Vitamin B5
Vit. B5
Vitamin B6
Vit. B6
Vitamin B12
Vit. B12
Vitamin K
Vit. K
Folate
Folate
159%
0%
1%
0.4%
20%
7.4%
9.4%
13%
26%
0%
1.8%
14%
2
100 g
300 g
1 fl oz - 29.6g
Vitamin C
Vit. C
Vitamin D
Vit. D
Vitamin A
Vit. A
Vitamin E
Vit. E
Vitamin B1
Vit. B1
Vitamin B2
Vit. B2
Vitamin B3
Vit. B3
Vitamin B5
Vit. B5
Vitamin B6
Vit. B6
Vitamin B12
Vit. B12
Vitamin K
Vit. K
Folate
Folate
0.67%
0%
0%
0.2%
0.25%
41%
98%
1.7%
0.46%
0%
0.25%
0.75%
All nutrients comparison - raw data values
Nutrient
DV% diff.
Vitamin C
47.8mg
0.2mg
53%
Caffeine
0mg
212mg
53%
Manganese
0.927mg
0.05mg
38%
Vitamin B3
0.5mg
5.207mg
29%
Magnesium
12mg
80mg
16%
Vitamin B2
0.032mg
0.177mg
11%
Vitamin B6
0.112mg
0.002mg
8%
Copper
0.11mg
0.05mg
7%
Vitamin B1
0.079mg
0.001mg
7%
Fiber
1.4g
0g
6%
Carbs
13.12g
1.67g
4%
Vitamin B5
0.213mg
0.028mg
4%
Folate
18µg
1µg
4%
Fructose
2.12g
3%
Calories
50kcal
9kcal
2%
Iron
0.29mg
0.13mg
2%
Protein
0.54g
0.12g
1%
Calcium
13mg
2mg
1%
Zinc
0.12mg
0.05mg
1%
Sodium
1mg
14mg
1%
Vitamin K
0.7µg
0.1µg
1%
Choline
5.5mg
2.6mg
1%
Protein per 100 calories
1.1g
1.3g
N/A
Calories per 10 g protein
926kcal
750kcal
N/A
Weight per 100 calories
200g
1111g
N/A
Fats
0.12g
0.18g
0%
Net carbs
11.72g
1.67g
N/A
Potassium
109mg
115mg
0%
Sugar
9.85g
0g
N/A
Phosphorus
8mg
7mg
0%
Vitamin A
3µg
0µg
0%
Vitamin E
0.02mg
0.01mg
0%
Selenium
0.1µg
0µg
0%
Saturated fat
0.009g
0.092g
0%
Monounsaturated fat
0.013g
0g
0%
Polyunsaturated fat
0.04g
0.092g
0%
Tryptophan
0.005mg
0%
Threonine
0.019mg
0%
Isoleucine
0.019mg
0%
Leucine
0.024mg
0%
Lysine
0.026mg
0%
Methionine
0.012mg
0%
Phenylalanine
0.021mg
0%
Valine
0.024mg
0%
Histidine
0.01mg
0%
Macronutrient Comparison
Macronutrient breakdown side-by-side comparison
2
13%
86%
Protein:
0.54 g
Fats:
0.12 g
Carbs:
13.12 g
Water:
86 g
Other:
0.22 g
3
2%
98%
Protein:
0.12 g
Fats:
0.18 g
Carbs:
1.67 g
Water:
97.8 g
Other:
0.23 g
Contains
more
Protein Protein
+350%
Contains
more
Carbs Carbs
+685.6%
Contains
more
Fats Fats
+50%
Contains
more
Water Water
+13.7%
Fat Type Comparison
Fat type breakdown side-by-side comparison
2
15%
21%
65%
Saturated fat:
Sat. Fat
0.009 g
Monounsaturated fat:
Mono. Fat
0.013 g
Polyunsaturated fat:
Poly. Fat
0.04 g
1
50%
50%
Saturated fat:
Sat. Fat
0.092 g
Monounsaturated fat:
Mono. Fat
0 g
Polyunsaturated fat:
Poly. Fat
0.092 g
Contains
less
Sat. Fat Saturated fat
-90.2%
Contains
more
Mono. Fat Monounsaturated fat
+∞%
Contains
more
Poly. Fat Polyunsaturated fat
+130%