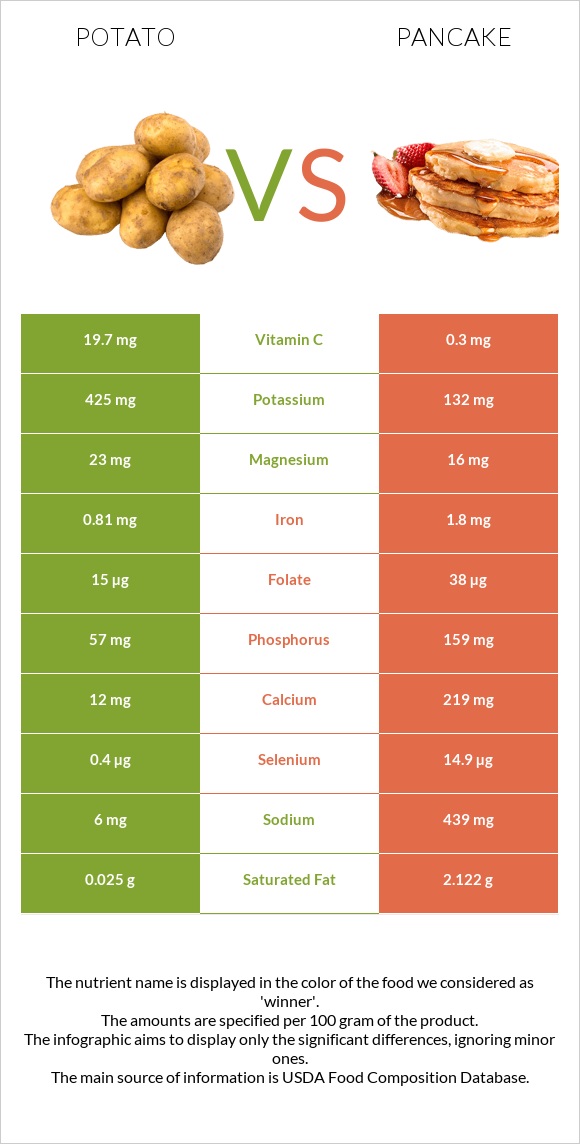
A recap on the differences between potatoes and pancake Potatoes have more vitamin C and vitamin B6; however, pancake is higher in selenium, calcium, vitamin B2, phosphorus, and iron. Pancake covers your daily selenium needs 26% more than potatoes. Pancake contains 66 times less vitamin C than potatoes. Potatoes contain 19.7mg of vitamin C, while pancake contains 0.3mg. Potatoes have less sodium. The glycemic index of potatoes is higher. Food varieties used in this article are Potatoes, flesh, and skin, raw and Pancakes, plain, prepared from recipe .
Infographic
Mineral Comparison
Mineral comparison score is based on the number of minerals by which one or the other food is richer. The "coverage" charts below show how much of the daily needs can be covered by 300 grams of the food.
4
100 g
300 g
0.5 cup, diced - 75g 1 Potato small (1-3/4" to 2-1/2" dia) - 170g 1 Potato medium (2-1/4" to 3-1/4" dia) - 213g 1 Potato large (3" to 4-1/4" dia) - 369g
Magnesium
Magnesium
Calcium
Calcium
Potassium
Potassium
Iron
Iron
Copper
Copper
Zinc
Zinc
Phosphorus
Phosphorus
Sodium
Sodium
Manganese
Manganese
Selenium
Selenium
16%
3.6%
38%
30%
37%
8.2%
24%
0.78%
26%
2.2%
5
100 g
300 g
1 oz - 28.35g 1 pancake (4" dia) - 38g 1 pancake (6" dia) - 77g
Magnesium
Magnesium
Calcium
Calcium
Potassium
Potassium
Iron
Iron
Copper
Copper
Zinc
Zinc
Phosphorus
Phosphorus
Sodium
Sodium
Manganese
Manganese
Selenium
Selenium
11%
66%
12%
68%
16%
15%
68%
57%
26%
81%
Vitamin Comparison
Vitamin comparison score is based on the number of vitamins by which one or the other food is richer. The "coverage" charts below show how much of the daily needs can be covered by 300 grams of the food.
4
100 g
300 g
0.5 cup, diced - 75g 1 Potato small (1-3/4" to 2-1/2" dia) - 170g 1 Potato medium (2-1/4" to 3-1/4" dia) - 213g 1 Potato large (3" to 4-1/4" dia) - 369g
Vitamin C
Vit. C
Vitamin D
Vit. D
Vitamin A
Vit. A
Vitamin E
Vit. E
Vitamin B1
Vit. B1
Vitamin B2
Vit. B2
Vitamin B3
Vit. B3
Vitamin B5
Vit. B5
Vitamin B6
Vit. B6
Vitamin B12
Vit. B12
Vitamin K
Vit. K
Folate
Folate
66%
0%
0%
0.2%
20%
7.4%
20%
18%
69%
0%
5%
11%
7
100 g
300 g
1 oz - 28.35g 1 pancake (4" dia) - 38g 1 pancake (6" dia) - 77g
Vitamin C
Vit. C
Vitamin D
Vit. D
Vitamin A
Vit. A
Vitamin E
Vit. E
Vitamin B1
Vit. B1
Vitamin B2
Vit. B2
Vitamin B3
Vit. B3
Vitamin B5
Vit. B5
Vitamin B6
Vit. B6
Vitamin B12
Vit. B12
Vitamin K
Vit. K
Folate
Folate
1%
0%
18%
0%
50%
65%
29%
24%
11%
28%
0%
29%
All nutrients comparison - raw data values
Nutrient
DV% diff.
Polyunsaturated fat
0.042g
4.447g
29%
Selenium
0.4µg
14.9µg
26%
Vitamin C
19.7mg
0.3mg
22%
Calcium
12mg
219mg
21%
Cholesterol
0mg
59mg
20%
Sodium
6mg
439mg
19%
Vitamin B2
0.032mg
0.281mg
19%
Vitamin B6
0.298mg
0.046mg
19%
Fats
0.09g
9.7g
15%
Phosphorus
57mg
159mg
15%
Iron
0.81mg
1.8mg
12%
Vitamin B1
0.081mg
0.201mg
10%
Saturated fat
0.025g
2.122g
10%
Protein
2.05g
6.4g
9%
Potassium
425mg
132mg
9%
Vitamin B12
0µg
0.22µg
9%
Calories
77kcal
227kcal
8%
Fiber
2.1g
8%
Copper
0.11mg
0.049mg
7%
Starch
15.29g
6%
Vitamin A
0µg
54µg
6%
Folate
15µg
38µg
6%
Monounsaturated fat
0.002g
2.474g
6%
Carbs
17.49g
28.3g
4%
Vitamin B3
1.061mg
1.567mg
3%
Magnesium
23mg
16mg
2%
Zinc
0.3mg
0.56mg
2%
Vitamin B5
0.295mg
0.405mg
2%
Vitamin K
2µg
2%
Choline
12.1mg
2%
Protein per 100 calories
2.7g
2.8g
N/A
Calories per 10 g protein
376kcal
355kcal
N/A
Weight per 100 calories
130g
44g
N/A
Unsaturated / Saturated Fat ratio
1.8
3.3
N/A
Net carbs
15.39g
28.3g
N/A
Sugar
0.82g
N/A
Vitamin E
0.01mg
0%
Manganese
0.2mg
0.2mg
0%
Tryptophan
0.021mg
0.08mg
0%
Threonine
0.067mg
0.237mg
0%
Isoleucine
0.066mg
0.297mg
0%
Leucine
0.098mg
0.513mg
0%
Lysine
0.107mg
0.321mg
0%
Methionine
0.032mg
0.147mg
0%
Phenylalanine
0.081mg
0.319mg
0%
Valine
0.103mg
0.335mg
0%
Histidine
0.035mg
0.152mg
0%
Fructose
0.26g
0%
Omega-3 - DHA
0g
0.005g
N/A
Macronutrient Comparison
Macronutrient breakdown side-by-side comparison
1
2%
17%
79%
Protein:
2.05 g
Fats:
0.09 g
Carbs:
17.49 g
Water:
79.25 g
Other:
1.12 g
4
6%
10%
28%
53%
3%
Protein:
6.4 g
Fats:
9.7 g
Carbs:
28.3 g
Water:
52.9 g
Other:
2.7 g
Contains
more
Water Water
+49.8%
Contains
more
Protein Protein
+212.2%
Contains
more
Fats Fats
+10677.8%
Contains
more
Carbs Carbs
+61.8%
Contains
more
Other Other
+141.1%
Fat Type Comparison
Fat type breakdown side-by-side comparison
1
36%
3%
61%
Saturated fat:
Sat. Fat
0.025 g
Monounsaturated fat:
Mono. Fat
0.002 g
Polyunsaturated fat:
Poly. Fat
0.042 g
2
23%
27%
49%
Saturated fat:
Sat. Fat
2.122 g
Monounsaturated fat:
Mono. Fat
2.474 g
Polyunsaturated fat:
Poly. Fat
4.447 g
Contains
less
Sat. Fat Saturated fat
-98.8%
Contains
more
Mono. Fat Monounsaturated fat
+123600%
Contains
more
Poly. Fat Polyunsaturated fat
+10488.1%