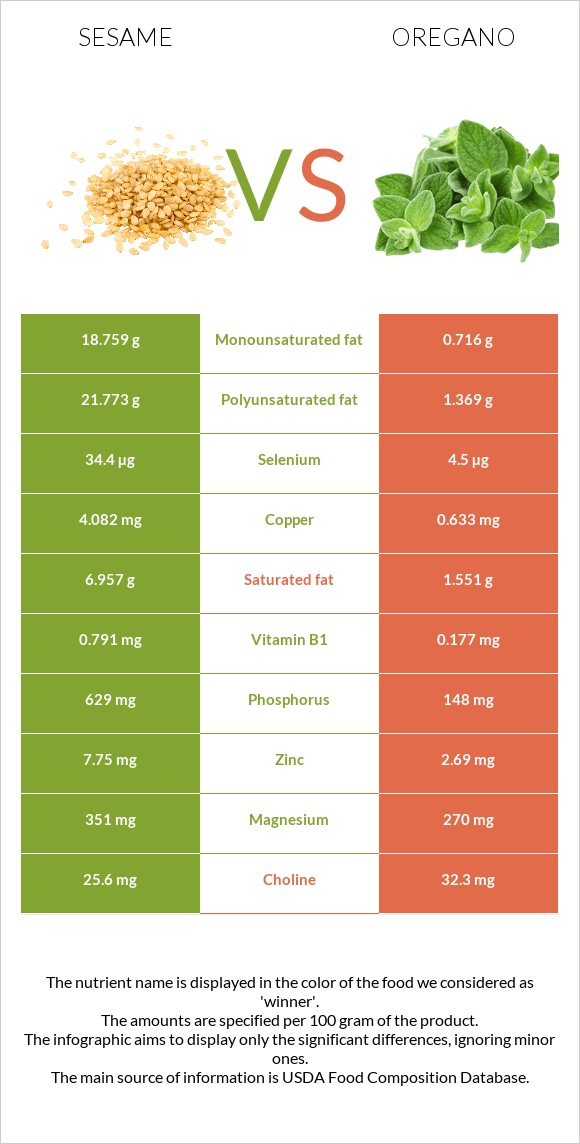
Significant differences between sesame and oregano Sesame has more copper, phosphorus, selenium, and vitamin B1; however, oregano is richer in vitamin K, iron, fiber, vitamin E, manganese, and calcium. Oregano covers your daily vitamin K needs 518% more than sesame. Oregano has 8 times less selenium than sesame. Sesame has 34.4µg of selenium, while oregano has 4.5µg. Specific food types used in this comparison are Seeds, sesame seeds, whole, dried and Spices, oregano, dried .
Infographic
Mineral Comparison
Mineral comparison score is based on the number of minerals by which one or the other food is richer. The "coverage" charts below show how much of the daily needs can be covered by 300 grams of the food.
6
100 g
300 g
1 tbsp - 9g 1 cup - 144g
Magnesium
Magnesium
Calcium
Calcium
Potassium
Potassium
Iron
Iron
Copper
Copper
Zinc
Zinc
Phosphorus
Phosphorus
Sodium
Sodium
Manganese
Manganese
Selenium
Selenium
251%
293%
41%
546%
1361%
211%
270%
1.4%
321%
188%
4
100 g
300 g
0.25 tsp - 0.5g 1 tsp, ground - 1.8g
Magnesium
Magnesium
Calcium
Calcium
Potassium
Potassium
Iron
Iron
Copper
Copper
Zinc
Zinc
Phosphorus
Phosphorus
Sodium
Sodium
Manganese
Manganese
Selenium
Selenium
193%
479%
111%
1380%
211%
73%
63%
3.3%
651%
25%
Vitamin Comparison
Vitamin comparison score is based on the number of vitamins by which one or the other food is richer. The "coverage" charts below show how much of the daily needs can be covered by 300 grams of the food.
1
100 g
300 g
1 tbsp - 9g 1 cup - 144g
Vitamin C
Vit. C
Vitamin D
Vit. D
Vitamin A
Vit. A
Vitamin E
Vit. E
Vitamin B1
Vit. B1
Vitamin B2
Vit. B2
Vitamin B3
Vit. B3
Vitamin B5
Vit. B5
Vitamin B6
Vit. B6
Vitamin B12
Vit. B12
Vitamin K
Vit. K
Folate
Folate
0%
0%
0%
5%
198%
57%
85%
3%
182%
0%
0%
73%
8
100 g
300 g
0.25 tsp - 0.5g 1 tsp, ground - 1.8g
Vitamin C
Vit. C
Vitamin D
Vit. D
Vitamin A
Vit. A
Vitamin E
Vit. E
Vitamin B1
Vit. B1
Vitamin B2
Vit. B2
Vitamin B3
Vit. B3
Vitamin B5
Vit. B5
Vitamin B6
Vit. B6
Vitamin B12
Vit. B12
Vitamin K
Vit. K
Folate
Folate
7.7%
0%
28%
365%
44%
122%
87%
55%
241%
0%
1554%
178%
All nutrients comparison - raw data values
Nutrient
DV% diff.
Vitamin K
0µg
621.7µg
518%
Copper
4.082mg
0.633mg
383%
Iron
14.55mg
36.8mg
278%
Polyunsaturated fat
21.773g
1.369g
136%
Fiber
11.8g
42.5g
123%
Vitamin E
0.25mg
18.26mg
120%
Manganese
2.46mg
4.99mg
110%
Fats
49.67g
4.28g
70%
Phosphorus
629mg
148mg
69%
Calcium
975mg
1597mg
62%
Selenium
34.4µg
4.5µg
54%
Vitamin B1
0.791mg
0.177mg
51%
Zinc
7.75mg
2.69mg
46%
Monounsaturated fat
18.759g
0.716g
45%
Folate
97µg
237µg
35%
Saturated fat
6.957g
1.551g
25%
Potassium
468mg
1260mg
23%
Vitamin B2
0.247mg
0.528mg
22%
Vitamin B6
0.79mg
1.044mg
20%
Magnesium
351mg
270mg
19%
Protein
17.73g
9g
17%
Vitamin B5
0.05mg
0.921mg
17%
Calories
573kcal
265kcal
15%
Carbs
23.45g
68.92g
15%
Vitamin A
0µg
85µg
9%
Vitamin C
0mg
2.3mg
3%
Sodium
11mg
25mg
1%
Vitamin B3
4.515mg
4.64mg
1%
Choline
25.6mg
32.3mg
1%
Fructose
1.13g
1%
Protein per 100 calories
3.1g
3.4g
N/A
Calories per 10 g protein
323kcal
294kcal
N/A
Weight per 100 calories
17g
38g
N/A
Unsaturated / Saturated Fat ratio
5.8
1.3
N/A
Net carbs
11.65g
26.42g
N/A
Sugar
0.3g
4.09g
N/A
Tryptophan
0.388mg
0.203mg
0%
Threonine
0.736mg
0.322mg
0%
Isoleucine
0.763mg
0.441mg
0%
Leucine
1.358mg
0.78mg
0%
Lysine
0.569mg
0.5mg
0%
Methionine
0.586mg
0.127mg
0%
Phenylalanine
0.94mg
0.449mg
0%
Valine
0.99mg
0.585mg
0%
Histidine
0.522mg
0.144mg
0%
Omega-3 - ALA
0.621g
N/A
Macronutrient Comparison
Macronutrient breakdown side-by-side comparison
2
18%
50%
23%
5%
4%
Protein:
17.73 g
Fats:
49.67 g
Carbs:
23.45 g
Water:
4.69 g
Other:
4.46 g
3
9%
4%
69%
10%
8%
Protein:
9 g
Fats:
4.28 g
Carbs:
68.92 g
Water:
9.93 g
Other:
7.87 g
Contains
more
Protein Protein
+97%
Contains
more
Fats Fats
+1060.5%
Contains
more
Carbs Carbs
+193.9%
Contains
more
Water Water
+111.7%
Contains
more
Other Other
+76.5%
Fat Type Comparison
Fat type breakdown side-by-side comparison
2
15%
40%
46%
Saturated fat:
Sat. Fat
6.957 g
Monounsaturated fat:
Mono. Fat
18.759 g
Polyunsaturated fat:
Poly. Fat
21.773 g
1
43%
20%
38%
Saturated fat:
Sat. Fat
1.551 g
Monounsaturated fat:
Mono. Fat
0.716 g
Polyunsaturated fat:
Poly. Fat
1.369 g
Contains
more
Mono. Fat Monounsaturated fat
+2520%
Contains
more
Poly. Fat Polyunsaturated fat
+1490.4%
Contains
less
Sat. Fat Saturated fat
-77.7%