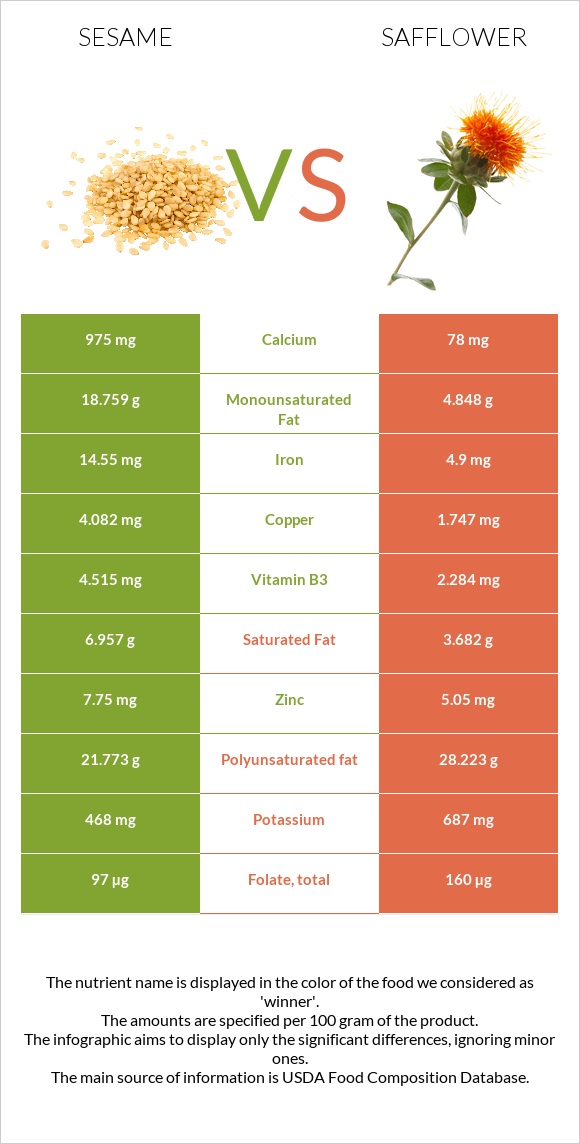
The main differences between sesame and safflower Sesame has more copper, iron, calcium, zinc, and manganese; however, safflower has more vitamin B5, vitamin B1, vitamin B6, and folate. Daily need coverage for copper for sesame is 259% higher. Safflower has 13 times less calcium than sesame. Sesame has 975mg of calcium, while safflower has 78mg. Safflower is lower in saturated fat. Food types used in this article are Seeds, sesame seeds, whole, dried and Seeds, safflower seed kernels, dried .
Infographic
Mineral Comparison
Mineral comparison score is based on the number of minerals by which one or the other food is richer. The "coverage" charts below show how much of the daily needs can be covered by 300 grams of the food.
6
100 g
300 g
1 tbsp - 9g 1 cup - 144g
Magnesium
Magnesium
Calcium
Calcium
Potassium
Potassium
Iron
Iron
Copper
Copper
Zinc
Zinc
Phosphorus
Phosphorus
Sodium
Sodium
Manganese
Manganese
Selenium
Selenium
251%
293%
41%
546%
1361%
211%
270%
1.4%
321%
188%
2
100 g
300 g
1 oz - 28.35g
Magnesium
Magnesium
Calcium
Calcium
Potassium
Potassium
Iron
Iron
Copper
Copper
Zinc
Zinc
Phosphorus
Phosphorus
Sodium
Sodium
Manganese
Manganese
Selenium
Selenium
252%
23%
61%
184%
582%
138%
276%
0.39%
263%
0%
Vitamin Comparison
Vitamin comparison score is based on the number of vitamins by which one or the other food is richer. The "coverage" charts below show how much of the daily needs can be covered by 300 grams of the food.
2
100 g
300 g
1 tbsp - 9g 1 cup - 144g
Vitamin C
Vit. C
Vitamin D
Vit. D
Vitamin A
Vit. A
Vitamin E
Vit. E
Vitamin B1
Vit. B1
Vitamin B2
Vit. B2
Vitamin B3
Vit. B3
Vitamin B5
Vit. B5
Vitamin B6
Vit. B6
Vitamin B12
Vit. B12
Vitamin K
Vit. K
Folate
Folate
0%
0%
0%
5%
198%
57%
85%
3%
182%
0%
0%
73%
6
100 g
300 g
1 oz - 28.35g
Vitamin C
Vit. C
Vitamin D
Vit. D
Vitamin A
Vit. A
Vitamin E
Vit. E
Vitamin B1
Vit. B1
Vitamin B2
Vit. B2
Vitamin B3
Vit. B3
Vitamin B5
Vit. B5
Vitamin B6
Vit. B6
Vitamin B12
Vit. B12
Vitamin K
Vit. K
Folate
Folate
0%
0%
1%
0%
291%
96%
43%
242%
270%
0%
0%
120%
All nutrients comparison - raw data values
Nutrient
DV% diff.
Copper
4.082mg
1.747mg
259%
Iron
14.55mg
4.9mg
121%
Calcium
975mg
78mg
90%
Vitamin B5
0.05mg
4.03mg
80%
Selenium
34.4µg
63%
Fiber
11.8g
47%
Polyunsaturated fat
21.773g
28.223g
43%
Monounsaturated fat
18.759g
4.848g
35%
Vitamin B1
0.791mg
1.163mg
31%
Vitamin B6
0.79mg
1.17mg
29%
Zinc
7.75mg
5.05mg
25%
Manganese
2.46mg
2.014mg
19%
Fats
49.67g
38.45g
17%
Folate
97µg
160µg
16%
Saturated fat
6.957g
3.682g
15%
Vitamin B3
4.515mg
2.284mg
14%
Vitamin B2
0.247mg
0.415mg
13%
Potassium
468mg
687mg
6%
Choline
25.6mg
5%
Carbs
23.45g
34.29g
4%
Calories
573kcal
517kcal
3%
Protein
17.73g
16.18g
3%
Phosphorus
629mg
644mg
2%
Vitamin E
0.25mg
2%
Protein per 100 calories
3.1g
3.1g
N/A
Calories per 10 g protein
323kcal
320kcal
N/A
Weight per 100 calories
17g
19g
N/A
Unsaturated / Saturated Fat ratio
5.8
9
N/A
Net carbs
11.65g
34.29g
N/A
Magnesium
351mg
353mg
0%
Sugar
0.3g
N/A
Sodium
11mg
3mg
0%
Vitamin A
0µg
3µg
0%
Tryptophan
0.388mg
0.183mg
0%
Threonine
0.736mg
0.586mg
0%
Isoleucine
0.763mg
0.717mg
0%
Leucine
1.358mg
1.154mg
0%
Lysine
0.569mg
0.534mg
0%
Methionine
0.586mg
0.284mg
0%
Phenylalanine
0.94mg
0.806mg
0%
Valine
0.99mg
1.025mg
0%
Histidine
0.522mg
0.452mg
0%
Macronutrient Comparison
Macronutrient breakdown side-by-side comparison
2
18%
50%
23%
5%
4%
Protein:
17.73 g
Fats:
49.67 g
Carbs:
23.45 g
Water:
4.69 g
Other:
4.46 g
3
16%
38%
34%
6%
5%
Protein:
16.18 g
Fats:
38.45 g
Carbs:
34.29 g
Water:
5.62 g
Other:
5.46 g
Contains
more
Fats Fats
+29.2%
Contains
more
Carbs Carbs
+46.2%
Contains
more
Water Water
+19.8%
Contains
more
Other Other
+22.4%
~equal in
Protein
~16.18g
Fat Type Comparison
Fat type breakdown side-by-side comparison
1
15%
40%
46%
Saturated fat:
Sat. Fat
6.957 g
Monounsaturated fat:
Mono. Fat
18.759 g
Polyunsaturated fat:
Poly. Fat
21.773 g
2
10%
13%
77%
Saturated fat:
Sat. Fat
3.682 g
Monounsaturated fat:
Mono. Fat
4.848 g
Polyunsaturated fat:
Poly. Fat
28.223 g
Contains
more
Mono. Fat Monounsaturated fat
+286.9%
Contains
less
Sat. Fat Saturated fat
-47.1%
Contains
more
Poly. Fat Polyunsaturated fat
+29.6%