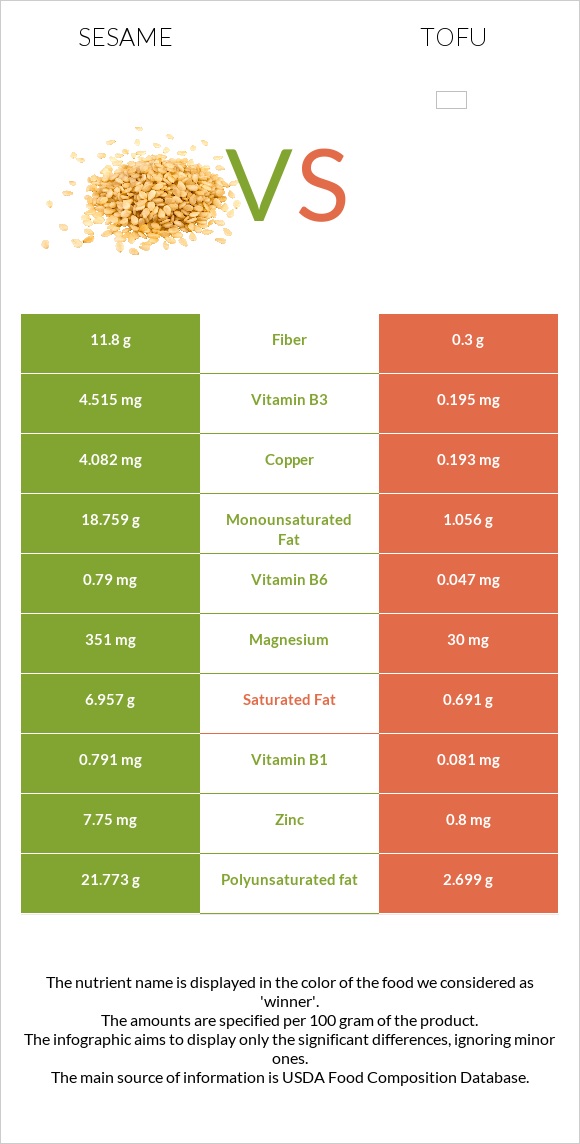
Significant differences between sesame and tofu The amount of copper, iron, manganese, magnesium, phosphorus, zinc, calcium, vitamin B1, vitamin B6, and selenium in sesame is higher than in tofu. Sesame covers your daily copper needs 432% more than tofu. Tofu has 17 times less vitamin B6 than sesame. Sesame has 0.79mg of vitamin B6, while tofu has 0.047mg. Specific food types used in this comparison are Seeds, sesame seeds, whole, dried and Tofu, raw, regular, prepared with calcium sulfate .
Infographic
Mineral Comparison
Mineral comparison score is based on the number of minerals by which one or the other food is richer. The "coverage" charts below show how much of the daily needs can be covered by 300 grams of the food.
9
100 g
300 g
1 tbsp - 9g 1 cup - 144g
Magnesium
Magnesium
Calcium
Calcium
Potassium
Potassium
Iron
Iron
Copper
Copper
Zinc
Zinc
Phosphorus
Phosphorus
Sodium
Sodium
Manganese
Manganese
Selenium
Selenium
251%
293%
41%
546%
1361%
211%
270%
1.4%
321%
188%
1
100 g
300 g
0.25 block - 116g 0.5 cup - 124g
Magnesium
Magnesium
Calcium
Calcium
Potassium
Potassium
Iron
Iron
Copper
Copper
Zinc
Zinc
Phosphorus
Phosphorus
Sodium
Sodium
Manganese
Manganese
Selenium
Selenium
21%
105%
11%
201%
64%
22%
42%
0.91%
79%
49%
Vitamin Comparison
Vitamin comparison score is based on the number of vitamins by which one or the other food is richer. The "coverage" charts below show how much of the daily needs can be covered by 300 grams of the food.
6
100 g
300 g
1 tbsp - 9g 1 cup - 144g
Vitamin C
Vit. C
Vitamin D
Vit. D
Vitamin A
Vit. A
Vitamin E
Vit. E
Vitamin B1
Vit. B1
Vitamin B2
Vit. B2
Vitamin B3
Vit. B3
Vitamin B5
Vit. B5
Vitamin B6
Vit. B6
Vitamin B12
Vit. B12
Vitamin K
Vit. K
Folate
Folate
0%
0%
0%
5%
198%
57%
85%
3%
182%
0%
0%
73%
3
100 g
300 g
0.25 block - 116g 0.5 cup - 124g
Vitamin C
Vit. C
Vitamin D
Vit. D
Vitamin A
Vit. A
Vitamin E
Vit. E
Vitamin B1
Vit. B1
Vitamin B2
Vit. B2
Vitamin B3
Vit. B3
Vitamin B5
Vit. B5
Vitamin B6
Vit. B6
Vitamin B12
Vit. B12
Vitamin K
Vit. K
Folate
Folate
0.33%
0%
0%
0.2%
20%
12%
3.7%
4.1%
11%
0%
6%
11%
All nutrients comparison - raw data values
Nutrient
DV% diff.
Copper
4.082mg
0.193mg
432%
Polyunsaturated fat
21.773g
2.699g
127%
Iron
14.55mg
5.36mg
115%
Manganese
2.46mg
0.605mg
81%
Magnesium
351mg
30mg
76%
Phosphorus
629mg
97mg
76%
Fats
49.67g
4.78g
69%
Calcium
975mg
350mg
63%
Zinc
7.75mg
0.8mg
63%
Vitamin B1
0.791mg
0.081mg
59%
Vitamin B6
0.79mg
0.047mg
57%
Fiber
11.8g
0.3g
46%
Selenium
34.4µg
8.9µg
46%
Monounsaturated fat
18.759g
1.056g
44%
Saturated fat
6.957g
0.691g
28%
Vitamin B3
4.515mg
0.195mg
27%
Calories
573kcal
76kcal
25%
Folate
97µg
15µg
21%
Protein
17.73g
8.08g
19%
Vitamin B2
0.247mg
0.052mg
15%
Potassium
468mg
121mg
10%
Carbs
23.45g
1.87g
7%
Vitamin E
0.25mg
0.01mg
2%
Vitamin K
0µg
2.4µg
2%
Choline
25.6mg
28.8mg
1%
Protein per 100 calories
3.1g
11g
N/A
Calories per 10 g protein
323kcal
94kcal
N/A
Weight per 100 calories
17g
132g
N/A
Unsaturated / Saturated Fat ratio
5.8
5.4
N/A
Vitamin C
0mg
0.1mg
0%
Net carbs
11.65g
1.57g
N/A
Sugar
0.3g
0.62g
N/A
Sodium
11mg
7mg
0%
Vitamin B5
0.05mg
0.068mg
0%
Tryptophan
0.388mg
0.12mg
0%
Threonine
0.736mg
0.402mg
0%
Isoleucine
0.763mg
0.435mg
0%
Leucine
1.358mg
0.713mg
0%
Lysine
0.569mg
0.452mg
0%
Methionine
0.586mg
0.108mg
0%
Phenylalanine
0.94mg
0.428mg
0%
Valine
0.99mg
0.446mg
0%
Histidine
0.522mg
0.221mg
0%
Macronutrient Comparison
Macronutrient breakdown side-by-side comparison
4
18%
50%
23%
5%
4%
Protein:
17.73 g
Fats:
49.67 g
Carbs:
23.45 g
Water:
4.69 g
Other:
4.46 g
1
8%
5%
2%
85%
Protein:
8.08 g
Fats:
4.78 g
Carbs:
1.87 g
Water:
84.55 g
Other:
0.72 g
Contains
more
Protein Protein
+119.4%
Contains
more
Fats Fats
+939.1%
Contains
more
Carbs Carbs
+1154%
Contains
more
Other Other
+519.4%
Contains
more
Water Water
+1702.8%
Fat Type Comparison
Fat type breakdown side-by-side comparison
2
15%
40%
46%
Saturated fat:
Sat. Fat
6.957 g
Monounsaturated fat:
Mono. Fat
18.759 g
Polyunsaturated fat:
Poly. Fat
21.773 g
1
16%
24%
61%
Saturated fat:
Sat. Fat
0.691 g
Monounsaturated fat:
Mono. Fat
1.056 g
Polyunsaturated fat:
Poly. Fat
2.699 g
Contains
more
Mono. Fat Monounsaturated fat
+1676.4%
Contains
more
Poly. Fat Polyunsaturated fat
+706.7%
Contains
less
Sat. Fat Saturated fat
-90.1%