
Snacks, corn-based, extruded, puffs or twists, cheese-flavor vs. Snacks, corn-based, extruded, puffs or twists, cheese-flavor, unenriched — In-Depth Nutrition Comparison
Compare
Significant differences between snacks, corn-based, extruded, puffs or twists, cheese-flavor and snacks, corn-based, extruded, puffs or twists, cheese-flavor, unenriched
- Snacks, corn-based, extruded, puffs or twists, cheese-flavor has more iron, vitamin B5, selenium, and omega-6 (Gamma-linolenic acid); however, snacks, corn-based, extruded, puffs or twists, cheese-flavor, unenriched is richer in vitamin K, folate, vitamin B3, and vitamin E.
- Snacks, corn-based, extruded, puffs or twists, cheese-flavor, unenriched covers your daily vitamin K needs 29% more than snacks, corn-based, extruded, puffs or twists, cheese-flavor.
Specific food types used in this comparison are Snacks, corn-based, extruded, puffs or twists, cheese-flavor and Snacks, corn-based, extruded, puffs or twists, cheese-flavor, unenriched.
Infographic
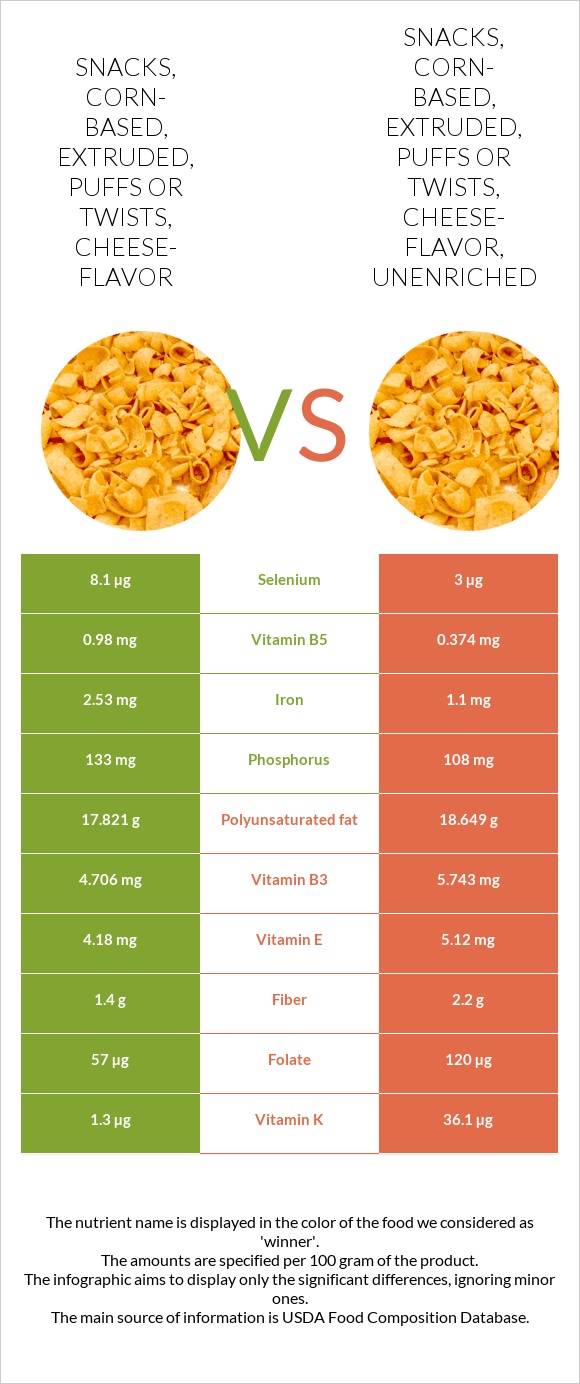
Infographic link
Mineral Comparison
The mineral comparison score is based on which food has a more favorable amount of each mineral. The �coverage� charts below show how much of the daily mineral needs are covered by the selected amount of each food.
| Contains more IronIron | +130% |
| Contains more PhosphorusPhosphorus | +23.1% |
| Contains more SeleniumSelenium | +170% |
| Contains more MagnesiumMagnesium | +17.6% |
| Contains more CopperCopper | +96.9% |
| Contains more ZincZinc | +50% |
| Contains more ManganeseManganese | +63.8% |
Vitamin Comparison
The vitamin comparison score is based on the number of vitamins in which one food is richer than the other. The �coverage� charts below show how much of the daily vitamin needs are covered by the selected amount of each food.
| Contains more Vitamin DVitamin D | +∞% |
| Contains more Vitamin B5Vitamin B5 | +162% |
| Contains more Vitamin B6Vitamin B6 | +23.4% |
| Contains more Vitamin EVitamin E | +22.5% |
| Contains more Vitamin B2Vitamin B2 | +25.8% |
| Contains more Vitamin B3Vitamin B3 | +22% |
| Contains more Vitamin KVitamin K | +2676.9% |
| Contains more FolateFolate | +110.5% |
All nutrients comparison - raw data values
| Nutrient |  |
|
DV% diff. |
| Omega-6 (Linoleic acid) | 17.143g | 101% | |
| Vitamin K | 1.3µg | 36.1µg | 29% |
| Starch | 46.8g | 19% | |
| Iron | 2.53mg | 1.1mg | 18% |
| Folate | 57µg | 120µg | 16% |
| Vitamin B5 | 0.98mg | 0.374mg | 12% |
| Selenium | 8.1µg | 3µg | 9% |
| Vitamin E | 4.18mg | 5.12mg | 6% |
| Vitamin B3 | 4.706mg | 5.743mg | 6% |
| Polyunsaturated fat | 17.821g | 18.649g | 6% |
| Phosphorus | 133mg | 108mg | 4% |
| Fiber | 1.4g | 2.2g | 3% |
| Copper | 0.032mg | 0.063mg | 3% |
| Vitamin B2 | 0.159mg | 0.2mg | 3% |
| Zinc | 0.4mg | 0.6mg | 2% |
| Sodium | 942mg | 896mg | 2% |
| Manganese | 0.058mg | 0.095mg | 2% |
| Choline | 11.6mg | 2% | |
| Cholesterol | 7mg | 4mg | 1% |
| Vitamin D | 0.1µg | 0µg | 1% |
| Magnesium | 17mg | 20mg | 1% |
| Vitamin B6 | 0.079mg | 0.064mg | 1% |
| Saturated fat | 5.36g | 5.512g | 1% |
| Monounsaturated fat | 10.052g | 10.437g | 1% |
| Omega-3 (ALA) | 0.312g | 0.3g | 1% |
| Calories | 560kcal | 558kcal | 0% |
| Protein | 5.85g | 5.76g | 0% |
| Protein per 100 calories | 1g | 1g | N/A |
| Calories per 10 g protein | 957kcal | 969kcal | N/A |
| Weight per 100 calories | 18g | 18g | N/A |
| Fats | 36.01g | 35.76g | 0% |
| Unsaturated / Saturated Fat ratio | 5.2 | 5.3 | N/A |
| Net carbs | 52.13g | 51.9g | N/A |
| Carbs | 53.53g | 54.1g | 0% |
| Vitamin D* | 2 IU | 0 IU | 0% |
| Calcium | 56mg | 58mg | 0% |
| Potassium | 182mg | 197mg | 0% |
| Sugar | 3.19g | 2.76g | N/A |
| Vitamin B1 | 0.16mg | 0.155mg | 0% |
| Vitamin B12 | 0.48µg | 0.48µg | 0% |
| Trans fat | 0.574g | 0.806g | N/A |
| Tryptophan | 0.072mg | 0.094mg | 0% |
| Threonine | 0.223mg | 0.391mg | 0% |
| Isoleucine | 0.369mg | 0.366mg | 0% |
| Leucine | 0.777mg | 0.783mg | 0% |
| Lysine | 0.424mg | 0.456mg | 0% |
| Methionine | 0.176mg | 0.151mg | 0% |
| Phenylalanine | 0.366mg | 0.299mg | 0% |
| Valine | 0.423mg | 0.404mg | 0% |
| Histidine | 0.221mg | 0.181mg | 0% |
| Omega-6 (Gamma-linolenic acid) | 0.01g | 0g | N/A |
| Omega-6 (Dihomo-gamma-linolenic acid) | 0.002g | N/A | |
| Omega-6 (Eicosadienoic acid) | 0.008g | 0g | N/A |
Macronutrient Comparison
Macronutrient breakdown side-by-side comparison
Protein:
5.85 g
Fats:
36.01 g
Carbs:
53.53 g
Water:
1.57 g
Other:
3.04 g
Protein:
5.76 g
Fats:
35.76 g
Carbs:
54.1 g
Water:
1.5 g
Other:
2.88 g
~equal in
Protein
~5.76g
~equal in
Fats
~35.76g
~equal in
Carbs
~54.1g
~equal in
Water
~1.5g
Fat Type Comparison
Fat type breakdown side-by-side comparison
Saturated fat:
Sat. Fat
5.36 g
Monounsaturated fat:
Mono. Fat
10.052 g
Polyunsaturated fat:
Poly. Fat
17.821 g
Saturated fat:
Sat. Fat
5.512 g
Monounsaturated fat:
Mono. Fat
10.437 g
Polyunsaturated fat:
Poly. Fat
18.649 g
~equal in
Saturated fat
~5.512g
~equal in
Monounsaturated fat
~10.437g
~equal in
Polyunsaturated fat
~18.649g
Carbohydrate type comparison
Carbohydrate type breakdown side-by-side comparison
Starch:
46.8 g
Sucrose:
0 g
Glucose:
0 g
Fructose:
0 g
Lactose:
3.19 g
Maltose:
0 g
Galactose:
0 g
Starch:
0 g
Sucrose:
0 g
Glucose:
0.15 g
Fructose:
0 g
Lactose:
2.12 g
Maltose:
0 g
Galactose:
0.07 g
| Contains more StarchStarch | +∞% |
| Contains more LactoseLactose | +50.5% |
| Contains more GlucoseGlucose | +∞% |
| Contains more GalactoseGalactose | +∞% |
~equal in
Sucrose
~0g
~equal in
Fructose
~0g
~equal in
Maltose
~0g