
Snacks, granola bars, soft, coated, milk chocolate coating, chocolate chip vs. Popcorn — In-Depth Nutrition Comparison
Compare
How are snacks, granola bars, soft, coated, milk chocolate coating, chocolate chip and popcorn different?
- Snacks, granola bars, soft, coated, milk chocolate coating, chocolate chip is richer in fats, vitamin B12, and vitamin B2, while popcorn is higher in fiber, phosphorus, magnesium, protein, zinc, and iron.
- Snacks, granola bars, soft, coated, milk chocolate coating, chocolate chip covers your daily need for saturated fat 68% more than popcorn.
- Popcorn is lower in saturated fat.
Snacks, granola bars, soft, coated, milk chocolate coating, chocolate chip and Snacks, popcorn, air-popped types were used in this article.
Infographic
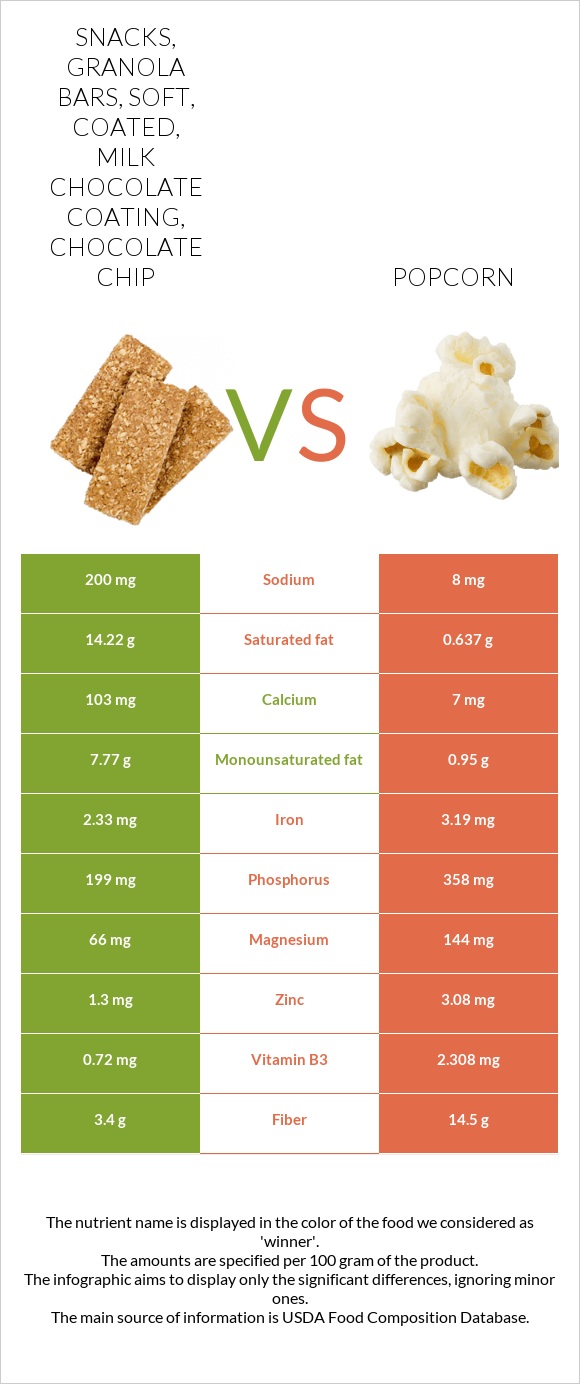
Infographic link
Mineral Comparison
The mineral comparison score is based on which food has a more favorable amount of each mineral. The �coverage� charts below show how much of the daily mineral needs are covered by the selected amount of each food.
| Contains more CalciumCalcium | +1371.4% |
| Contains more CopperCopper | +33.6% |
| Contains more MagnesiumMagnesium | +118.2% |
| Contains more IronIron | +36.9% |
| Contains more ZincZinc | +136.9% |
| Contains more PhosphorusPhosphorus | +79.9% |
| Contains less SodiumSodium | -96% |
| Contains more ManganeseManganese | +19.7% |
Vitamin Comparison
The vitamin comparison score is based on the number of vitamins in which one food is richer than the other. The �coverage� charts below show how much of the daily vitamin needs are covered by the selected amount of each food.
| Contains more Vitamin B2Vitamin B2 | +201.2% |
| Contains more Vitamin B12Vitamin B12 | +∞% |
| Contains more Vitamin AVitamin A | +42.9% |
| Contains more Vitamin EVitamin E | +∞% |
| Contains more Vitamin B1Vitamin B1 | +15.6% |
| Contains more Vitamin B3Vitamin B3 | +220.6% |
| Contains more Vitamin B6Vitamin B6 | +57% |
| Contains more Vitamin KVitamin K | +∞% |
| Contains more FolateFolate | +19.2% |
All nutrients comparison - raw data values
| Nutrient |  |
 |
DV% diff. |
| Saturated fat | 14.22g | 0.637g | 62% |
| Fiber | 3.4g | 14.5g | 44% |
| Fats | 24.9g | 4.54g | 31% |
| Vitamin B12 | 0.57µg | 0µg | 24% |
| Phosphorus | 199mg | 358mg | 23% |
| Starch | 54.4g | 22% | |
| Magnesium | 66mg | 144mg | 19% |
| Monounsaturated fat | 7.77g | 0.95g | 17% |
| Zinc | 1.3mg | 3.08mg | 16% |
| Protein | 5.8g | 12.94g | 14% |
| Vitamin B2 | 0.25mg | 0.083mg | 13% |
| Iron | 2.33mg | 3.19mg | 11% |
| Calcium | 103mg | 7mg | 10% |
| Copper | 0.35mg | 0.262mg | 10% |
| Vitamin B3 | 0.72mg | 2.308mg | 10% |
| Sodium | 200mg | 8mg | 8% |
| Manganese | 0.93mg | 1.113mg | 8% |
| Carbs | 63.8g | 77.78g | 5% |
| Calories | 466kcal | 387kcal | 4% |
| Vitamin B6 | 0.1mg | 0.157mg | 4% |
| Choline | 21.2mg | 4% | |
| Polyunsaturated fat | 1.82g | 2.318g | 3% |
| Cholesterol | 5mg | 0mg | 2% |
| Vitamin E | 0.29mg | 2% | |
| Vitamin B1 | 0.09mg | 0.104mg | 1% |
| Vitamin K | 1.2µg | 1% | |
| Folate | 26µg | 31µg | 1% |
| Protein per 100 calories | 1.2g | 3.3g | N/A |
| Calories per 10 g protein | 803kcal | 299kcal | N/A |
| Weight per 100 calories | 21g | 26g | N/A |
| Unsaturated / Saturated Fat ratio | 0.67 | 5.1 | N/A |
| Net carbs | 60.4g | 63.28g | N/A |
| Potassium | 313mg | 329mg | 0% |
| Sugar | 0.87g | N/A | |
| Vitamin A | 7µg | 10µg | 0% |
| Vitamin B5 | 0.51mg | 0.51mg | 0% |
| Tryptophan | 0.07mg | 0.085mg | 0% |
| Threonine | 0.226mg | 0.452mg | 0% |
| Isoleucine | 0.27mg | 0.431mg | 0% |
| Leucine | 0.474mg | 1.473mg | 0% |
| Lysine | 0.289mg | 0.338mg | 0% |
| Methionine | 0.114mg | 0.252mg | 0% |
| Phenylalanine | 0.291mg | 0.59mg | 0% |
| Valine | 0.345mg | 0.607mg | 0% |
| Histidine | 0.105mg | 0.367mg | 0% |
| Fructose | 0.07g | 0% |
Macronutrient Comparison
Macronutrient breakdown side-by-side comparison
Protein:
5.8 g
Fats:
24.9 g
Carbs:
63.8 g
Water:
3.6 g
Other:
1.9 g
Protein:
12.94 g
Fats:
4.54 g
Carbs:
77.78 g
Water:
3.32 g
Other:
1.42 g
| Contains more FatsFats | +448.5% |
| Contains more ProteinProtein | +123.1% |
| Contains more CarbsCarbs | +21.9% |
~equal in
Water
~3.32g
Fat Type Comparison
Fat type breakdown side-by-side comparison
Saturated fat:
Sat. Fat
14.22 g
Monounsaturated fat:
Mono. Fat
7.77 g
Polyunsaturated fat:
Poly. Fat
1.82 g
Saturated fat:
Sat. Fat
0.637 g
Monounsaturated fat:
Mono. Fat
0.95 g
Polyunsaturated fat:
Poly. Fat
2.318 g
| Contains more Mono. FatMonounsaturated fat | +717.9% |
| Contains less Sat. FatSaturated fat | -95.5% |
| Contains more Poly. FatPolyunsaturated fat | +27.4% |