
Soymilk, chocolate and other flavors, light, with added calcium, vitamins A and D vs. Soybean meal — In-Depth Nutrition Comparison
Compare
What are the main differences between soymilk, chocolate and other flavors, light, with added calcium, vitamins A and D and soybean meal?
- Soybean meal has more copper, iron, manganese, protein, phosphorus, folate, magnesium, potassium, vitamin B1, and zinc than soymilk, chocolate, and other flavors, light, with added calcium, vitamins A, and D.
- Soybean meal's daily need coverage for copper is 200% higher.
We used Soymilk, chocolate, and other flavors, light, with added calcium, vitamins A, and D and Soy meal, defatted, raw types in this comparison.
Infographic
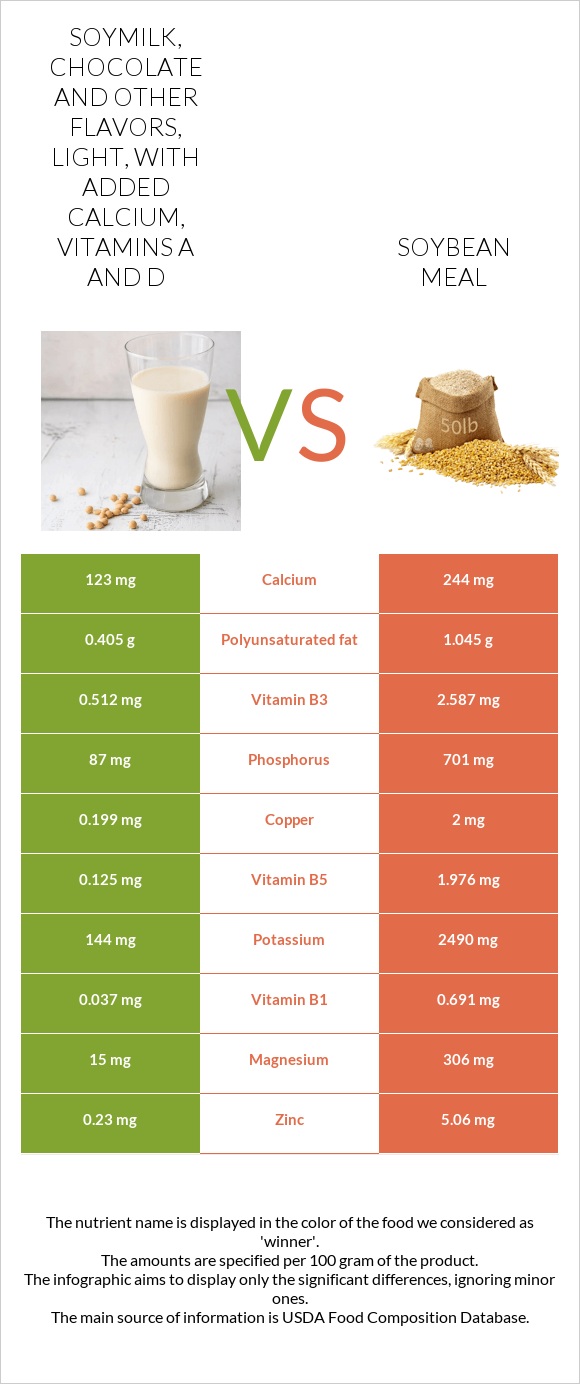
Infographic link
Mineral Comparison
The mineral comparison score is based on which food has a more favorable amount of each mineral. The �coverage� charts below show how much of the daily mineral needs are covered by the selected amount of each food.
| Contains more MagnesiumMagnesium | +1940% |
| Contains more CalciumCalcium | +98.4% |
| Contains more PotassiumPotassium | +1629.2% |
| Contains more IronIron | +2222% |
| Contains more CopperCopper | +905% |
| Contains more ZincZinc | +2100% |
| Contains more PhosphorusPhosphorus | +705.7% |
| Contains less SodiumSodium | -93.5% |
| Contains more ManganeseManganese | +5035.1% |
| Contains more SeleniumSelenium | +94.1% |
Vitamin Comparison
The vitamin comparison score is based on the number of vitamins in which one food is richer than the other. The �coverage� charts below show how much of the daily vitamin needs are covered by the selected amount of each food.
| Contains more Vitamin DVitamin D | +∞% |
| Contains more Vitamin AVitamin A | +2950% |
| Contains more Vitamin EVitamin E | +∞% |
| Contains more Vitamin B12Vitamin B12 | +∞% |
| Contains more Vitamin KVitamin K | +∞% |
| Contains more Vitamin B1Vitamin B1 | +1767.6% |
| Contains more Vitamin B2Vitamin B2 | +24.9% |
| Contains more Vitamin B3Vitamin B3 | +405.3% |
| Contains more Vitamin B5Vitamin B5 | +1480.8% |
| Contains more Vitamin B6Vitamin B6 | +1437.8% |
| Contains more FolateFolate | +3266.7% |
All nutrients comparison - raw data values
| Nutrient |  |
 |
DV% diff. |
| Copper | 0.199mg | 2mg | 200% |
| Iron | 0.59mg | 13.7mg | 164% |
| Manganese | 0.074mg | 3.8mg | 162% |
| Protein | 2.1g | 49.2g | 94% |
| Phosphorus | 87mg | 701mg | 88% |
| Folate | 9µg | 303µg | 74% |
| Magnesium | 15mg | 306mg | 69% |
| Potassium | 144mg | 2490mg | 69% |
| Vitamin B1 | 0.037mg | 0.691mg | 55% |
| Zinc | 0.23mg | 5.06mg | 44% |
| Vitamin B12 | 1µg | 0µg | 42% |
| Vitamin B6 | 0.037mg | 0.569mg | 41% |
| Vitamin B5 | 0.125mg | 1.976mg | 37% |
| Calories | 47kcal | 337kcal | 15% |
| Vitamin B3 | 0.512mg | 2.587mg | 13% |
| Calcium | 123mg | 244mg | 12% |
| Carbs | 8.24g | 35.89g | 9% |
| Vitamin A | 61µg | 2µg | 7% |
| Vitamin D* | 47 IU | 0 IU | 6% |
| Vitamin D | 1.2µg | 0µg | 6% |
| Choline | 28.4mg | 5% | |
| Vitamin B2 | 0.201mg | 0.251mg | 4% |
| Polyunsaturated fat | 0.405g | 1.045g | 4% |
| Fats | 0.64g | 2.39g | 3% |
| Fiber | 0.7g | 3% | |
| Selenium | 1.7µg | 3.3µg | 3% |
| Vitamin K | 3.6µg | 3% | |
| Sodium | 46mg | 3mg | 2% |
| Vitamin E | 0.13mg | 1% | |
| Saturated fat | 0.032g | 0.268g | 1% |
| Monounsaturated fat | 0.037g | 0.409g | 1% |
| Caffeine | 2mg | 1% | |
| Protein per 100 calories | 4.5g | 15g | N/A |
| Calories per 10 g protein | 224kcal | 68kcal | N/A |
| Weight per 100 calories | 213g | 30g | N/A |
| Unsaturated / Saturated Fat ratio | 14 | 5.4 | N/A |
| Net carbs | 7.54g | 35.89g | N/A |
| Sugar | 7.13g | N/A | |
| Tryptophan | 0.653mg | 0% | |
| Threonine | 1.952mg | 0% | |
| Isoleucine | 2.18mg | 0% | |
| Leucine | 3.66mg | 0% | |
| Lysine | 2.991mg | 0% | |
| Methionine | 0.606mg | 0% | |
| Phenylalanine | 2.346mg | 0% | |
| Valine | 2.243mg | 0% | |
| Histidine | 1.212mg | 0% |
Macronutrient Comparison
Macronutrient breakdown side-by-side comparison
Protein:
2.1 g
Fats:
0.64 g
Carbs:
8.24 g
Water:
88.38 g
Other:
0.64 g
Protein:
49.2 g
Fats:
2.39 g
Carbs:
35.89 g
Water:
6.94 g
Other:
5.58 g
| Contains more WaterWater | +1173.5% |
| Contains more ProteinProtein | +2242.9% |
| Contains more FatsFats | +273.4% |
| Contains more CarbsCarbs | +335.6% |
Fat Type Comparison
Fat type breakdown side-by-side comparison
Saturated fat:
Sat. Fat
0.032 g
Monounsaturated fat:
Mono. Fat
0.037 g
Polyunsaturated fat:
Poly. Fat
0.405 g
Saturated fat:
Sat. Fat
0.268 g
Monounsaturated fat:
Mono. Fat
0.409 g
Polyunsaturated fat:
Poly. Fat
1.045 g
| Contains less Sat. FatSaturated fat | -88.1% |
| Contains more Mono. FatMonounsaturated fat | +1005.4% |
| Contains more Poly. FatPolyunsaturated fat | +158% |