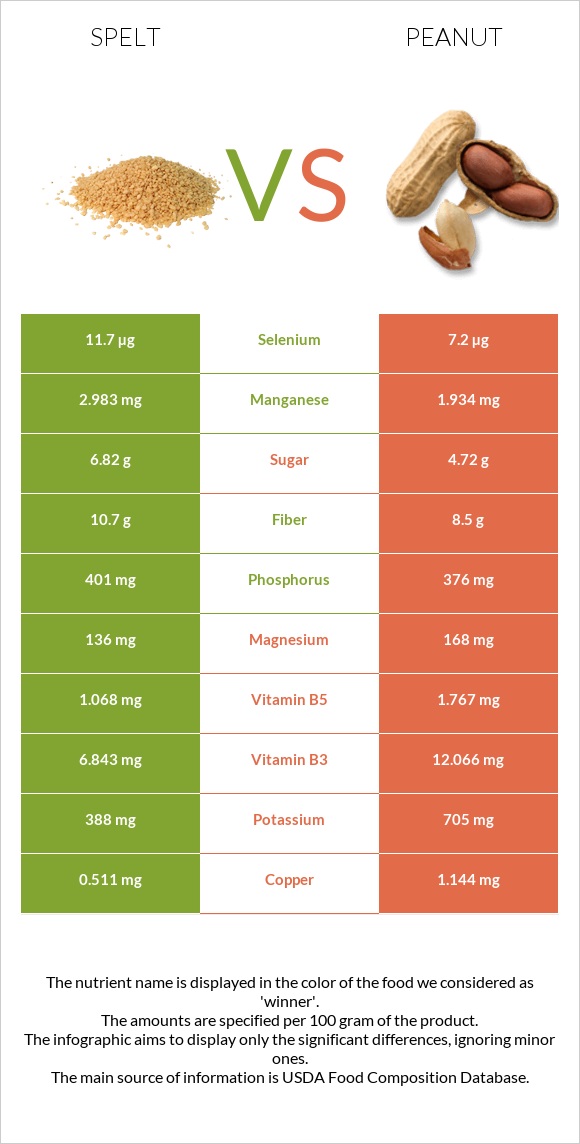
What are the differences between spelt and peanuts? Spelt is higher in manganese, yet peanuts are higher in copper, vitamin E, folate, vitamin B3, vitamin B1, vitamin B5, potassium, and vitamin B6. Peanuts' daily need coverage for copper is 70% more. Spelt has 2 times more manganese than peanuts. While spelt has 2.983mg of manganese, peanuts have only 1.934mg. The amount of saturated fat in spelt is lower. The glycemic index of peanuts is lower. We used Spelt, uncooked and Peanuts, all types, raw types in this article.
Infographic
Mineral Comparison
Mineral comparison score is based on the number of minerals by which one or the other food is richer. The "coverage" charts below show how much of the daily needs can be covered by 300 grams of the food.
3
100 g
300 g
1 cup - 174g
Magnesium
Magnesium
Calcium
Calcium
Potassium
Potassium
Iron
Iron
Copper
Copper
Zinc
Zinc
Phosphorus
Phosphorus
Sodium
Sodium
Manganese
Manganese
Selenium
Selenium
97%
8.1%
34%
167%
170%
89%
172%
1%
389%
64%
4
100 g
300 g
1 oz - 28.35g 1 cup - 146g
Magnesium
Magnesium
Calcium
Calcium
Potassium
Potassium
Iron
Iron
Copper
Copper
Zinc
Zinc
Phosphorus
Phosphorus
Sodium
Sodium
Manganese
Manganese
Selenium
Selenium
120%
28%
62%
172%
381%
89%
161%
2.3%
252%
39%
Vitamin Comparison
Vitamin comparison score is based on the number of vitamins by which one or the other food is richer. The "coverage" charts below show how much of the daily needs can be covered by 300 grams of the food.
1
100 g
300 g
1 cup - 174g
Vitamin C
Vit. C
Vitamin D
Vit. D
Vitamin A
Vit. A
Vitamin E
Vit. E
Vitamin B1
Vit. B1
Vitamin B2
Vit. B2
Vitamin B3
Vit. B3
Vitamin B5
Vit. B5
Vitamin B6
Vit. B6
Vitamin B12
Vit. B12
Vitamin K
Vit. K
Folate
Folate
0%
0%
0%
16%
91%
26%
128%
64%
53%
0%
9%
34%
7
100 g
300 g
1 oz - 28.35g 1 cup - 146g
Vitamin C
Vit. C
Vitamin D
Vit. D
Vitamin A
Vit. A
Vitamin E
Vit. E
Vitamin B1
Vit. B1
Vitamin B2
Vit. B2
Vitamin B3
Vit. B3
Vitamin B5
Vit. B5
Vitamin B6
Vit. B6
Vitamin B12
Vit. B12
Vitamin K
Vit. K
Folate
Folate
0%
0%
0%
167%
160%
31%
226%
106%
80%
0%
0%
180%
All nutrients comparison - raw data values
Nutrient
DV% diff.
Polyunsaturated fat
1.258g
15.558g
95%
Fats
2.43g
49.24g
72%
Copper
0.511mg
1.144mg
70%
Monounsaturated fat
0.445g
24.426g
60%
Vitamin E
0.79mg
8.33mg
50%
Folate
45µg
240µg
49%
Manganese
2.983mg
1.934mg
46%
Vitamin B3
6.843mg
12.066mg
33%
Saturated fat
0.406g
6.279g
27%
Vitamin B1
0.364mg
0.64mg
23%
Protein
14.57g
25.8g
22%
Starch
53.92g
22%
Carbs
70.19g
16.13g
18%
Vitamin B5
1.068mg
1.767mg
14%
Calories
338kcal
567kcal
11%
Choline
52.5mg
10%
Potassium
388mg
705mg
9%
Fiber
10.7g
8.5g
9%
Vitamin B6
0.23mg
0.348mg
9%
Magnesium
136mg
168mg
8%
Selenium
11.7µg
7.2µg
8%
Calcium
27mg
92mg
7%
Phosphorus
401mg
376mg
4%
Vitamin K
3.6µg
0µg
3%
Iron
4.44mg
4.58mg
2%
Vitamin B2
0.113mg
0.135mg
2%
Protein per 100 calories
4.3g
4.6g
N/A
Calories per 10 g protein
232kcal
220kcal
N/A
Weight per 100 calories
30g
18g
N/A
Unsaturated / Saturated Fat ratio
4.2
6.4
N/A
Net carbs
59.49g
7.63g
N/A
Sugar
6.82g
4.72g
N/A
Zinc
3.28mg
3.27mg
0%
Sodium
8mg
18mg
0%
Tryptophan
0.132mg
0.25mg
0%
Threonine
0.443mg
0.883mg
0%
Isoleucine
0.552mg
0.907mg
0%
Leucine
1.07mg
1.672mg
0%
Lysine
0.409mg
0.926mg
0%
Methionine
0.258mg
0.317mg
0%
Phenylalanine
0.737mg
1.377mg
0%
Valine
0.681mg
1.082mg
0%
Histidine
0.36mg
0.652mg
0%
Fructose
0.24g
0%
Omega-3 - ALA
0.065g
N/A
Macronutrient Comparison
Macronutrient breakdown side-by-side comparison
2
15%
2%
70%
11%
2%
Protein:
14.57 g
Fats:
2.43 g
Carbs:
70.19 g
Water:
11.02 g
Other:
1.79 g
3
26%
49%
16%
7%
2%
Protein:
25.8 g
Fats:
49.24 g
Carbs:
16.13 g
Water:
6.5 g
Other:
2.33 g
Contains
more
Carbs Carbs
+335.2%
Contains
more
Water Water
+69.5%
Contains
more
Protein Protein
+77.1%
Contains
more
Fats Fats
+1926.3%
Contains
more
Other Other
+30.2%
Fat Type Comparison
Fat type breakdown side-by-side comparison
1
19%
21%
60%
Saturated fat:
Sat. Fat
0.406 g
Monounsaturated fat:
Mono. Fat
0.445 g
Polyunsaturated fat:
Poly. Fat
1.258 g
2
14%
53%
34%
Saturated fat:
Sat. Fat
6.279 g
Monounsaturated fat:
Mono. Fat
24.426 g
Polyunsaturated fat:
Poly. Fat
15.558 g
Contains
less
Sat. Fat Saturated fat
-93.5%
Contains
more
Mono. Fat Monounsaturated fat
+5389%
Contains
more
Poly. Fat Polyunsaturated fat
+1136.7%