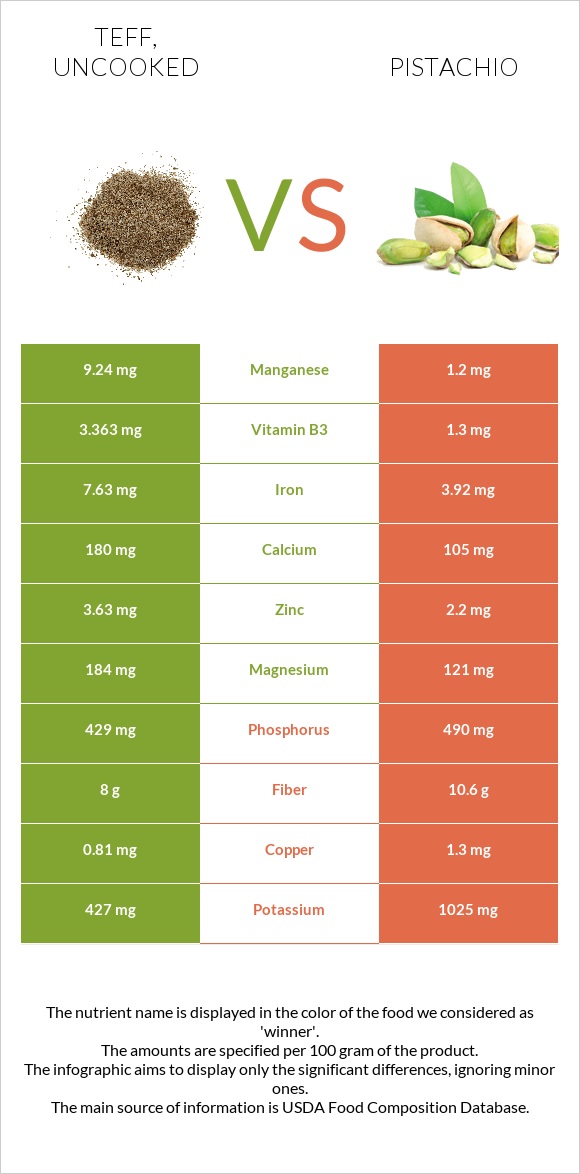
Summary of differences between teff and pistachios Teff has more manganese, iron, magnesium, and zinc, while pistachios have more vitamin B6, copper, vitamin B1, vitamin E, and potassium. Teff covers your daily need for manganese, 350% more than pistachios. Teff contains 2 times more iron than pistachios. While teff contains 7.63mg of iron, pistachios contain only 3.92mg. The amount of saturated fat in teff is lower. These are the specific foods used in this comparison Teff, uncooked and Nuts, pistachio nuts, raw .
Infographic
Mineral Comparison
Mineral comparison score is based on the number of minerals by which one or the other food is richer. The "coverage" charts below show how much of the daily needs can be covered by 300 grams of the food.
5
100 g
300 g
1 cup - 193g
Magnesium
Magnesium
Calcium
Calcium
Potassium
Potassium
Iron
Iron
Copper
Copper
Zinc
Zinc
Phosphorus
Phosphorus
Sodium
Sodium
Manganese
Manganese
Selenium
Selenium
131%
54%
38%
286%
270%
99%
184%
1.6%
1205%
24%
5
100 g
300 g
1 kernel - 0.7g 1 oz (49 kernels) - 28.35g 1 cup - 123g
Magnesium
Magnesium
Calcium
Calcium
Potassium
Potassium
Iron
Iron
Copper
Copper
Zinc
Zinc
Phosphorus
Phosphorus
Sodium
Sodium
Manganese
Manganese
Selenium
Selenium
86%
32%
90%
147%
433%
60%
210%
0.13%
157%
38%
Vitamin Comparison
Vitamin comparison score is based on the number of vitamins by which one or the other food is richer. The "coverage" charts below show how much of the daily needs can be covered by 300 grams of the food.
4
100 g
300 g
1 cup - 193g
Vitamin C
Vit. C
Vitamin D
Vit. D
Vitamin A
Vit. A
Vitamin E
Vit. E
Vitamin B1
Vit. B1
Vitamin B2
Vit. B2
Vitamin B3
Vit. B3
Vitamin B5
Vit. B5
Vitamin B6
Vit. B6
Vitamin B12
Vit. B12
Vitamin K
Vit. K
Folate
Folate
0%
0%
0%
1.6%
98%
62%
63%
57%
111%
0%
4.8%
0%
6
100 g
300 g
1 kernel - 0.7g 1 oz (49 kernels) - 28.35g 1 cup - 123g
Vitamin C
Vit. C
Vitamin D
Vit. D
Vitamin A
Vit. A
Vitamin E
Vit. E
Vitamin B1
Vit. B1
Vitamin B2
Vit. B2
Vitamin B3
Vit. B3
Vitamin B5
Vit. B5
Vitamin B6
Vit. B6
Vitamin B12
Vit. B12
Vitamin K
Vit. K
Folate
Folate
19%
0%
8.7%
57%
218%
37%
24%
31%
392%
0%
0%
38%
All nutrients comparison - raw data values
Nutrient
DV% diff.
Manganese
9.24mg
1.2mg
350%
Vitamin B6
0.482mg
1.7mg
94%
Polyunsaturated fat
1.071g
14.38g
89%
Fats
2.38g
45.32g
66%
Monounsaturated fat
0.589g
23.257g
57%
Copper
0.81mg
1.3mg
54%
Iron
7.63mg
3.92mg
46%
Vitamin B1
0.39mg
0.87mg
40%
Saturated fat
0.449g
5.907g
25%
Vitamin E
0.08mg
2.86mg
19%
Potassium
427mg
1025mg
18%
Carbs
73.13g
27.17g
15%
Magnesium
184mg
121mg
15%
Protein
13.3g
20.16g
14%
Starch
36.56g
1.67g
14%
Zinc
3.63mg
2.2mg
13%
Vitamin B3
3.363mg
1.3mg
13%
Folate
51µg
13%
Calories
367kcal
560kcal
10%
Fiber
8g
10.6g
10%
Phosphorus
429mg
490mg
9%
Calcium
180mg
105mg
8%
Vitamin B2
0.27mg
0.16mg
8%
Vitamin B5
0.942mg
0.52mg
8%
Vitamin C
5.6mg
6%
Selenium
4.4µg
7µg
5%
Vitamin A
0µg
26µg
3%
Vitamin K
1.9µg
2%
Choline
13.1mg
2%
Protein per 100 calories
3.6g
3.6g
N/A
Calories per 10 g protein
276kcal
278kcal
N/A
Weight per 100 calories
27g
18g
N/A
Unsaturated / Saturated Fat ratio
3.7
6.4
N/A
Net carbs
65.13g
16.57g
N/A
Sugar
1.84g
7.66g
N/A
Sodium
12mg
1mg
0%
Tryptophan
0.139mg
0.251mg
0%
Threonine
0.51mg
0.684mg
0%
Isoleucine
0.501mg
0.917mg
0%
Leucine
1.068mg
1.604mg
0%
Lysine
0.376mg
1.138mg
0%
Methionine
0.428mg
0.36mg
0%
Phenylalanine
0.698mg
1.092mg
0%
Valine
0.686mg
1.249mg
0%
Histidine
0.301mg
0.512mg
0%
Fructose
0.47g
0.24g
0%
Omega-3 - ALA
0.135g
N/A
Omega-6 - Linoleic acid
14.091g
N/A
Macronutrient Comparison
Macronutrient breakdown side-by-side comparison
2
13%
2%
73%
9%
2%
Protein:
13.3 g
Fats:
2.38 g
Carbs:
73.13 g
Water:
8.82 g
Other:
2.37 g
3
20%
45%
27%
4%
3%
Protein:
20.16 g
Fats:
45.32 g
Carbs:
27.17 g
Water:
4.37 g
Other:
2.98 g
Contains
more
Carbs Carbs
+169.2%
Contains
more
Water Water
+101.8%
Contains
more
Protein Protein
+51.6%
Contains
more
Fats Fats
+1804.2%
Contains
more
Other Other
+25.7%
Fat Type Comparison
Fat type breakdown side-by-side comparison
1
21%
28%
51%
Saturated fat:
Sat. Fat
0.449 g
Monounsaturated fat:
Mono. Fat
0.589 g
Polyunsaturated fat:
Poly. Fat
1.071 g
2
14%
53%
33%
Saturated fat:
Sat. Fat
5.907 g
Monounsaturated fat:
Mono. Fat
23.257 g
Polyunsaturated fat:
Poly. Fat
14.38 g
Contains
less
Sat. Fat Saturated fat
-92.4%
Contains
more
Mono. Fat Monounsaturated fat
+3848.6%
Contains
more
Poly. Fat Polyunsaturated fat
+1242.7%
Carbohydrate type comparison
Carbohydrate type breakdown side-by-side comparison
3
95%
2%
Starch:
36.56 g
Sucrose:
0.62 g
Glucose:
0.73 g
Fructose:
0.47 g
Lactose:
0 g
Maltose:
0.01 g
Galactose:
0 g
2
18%
74%
3%
3%
2%
Starch:
1.67 g
Sucrose:
6.87 g
Glucose:
0.32 g
Fructose:
0.24 g
Lactose:
0 g
Maltose:
0.17 g
Galactose:
0 g
Contains
more
Starch Starch
+2089.2%
Contains
more
Glucose Glucose
+128.1%
Contains
more
Fructose Fructose
+95.8%
Contains
more
Sucrose Sucrose
+1008.1%
Contains
more
Maltose Maltose
+1600%
~equal in
Lactose
~0g
~equal in
Galactose
~0g