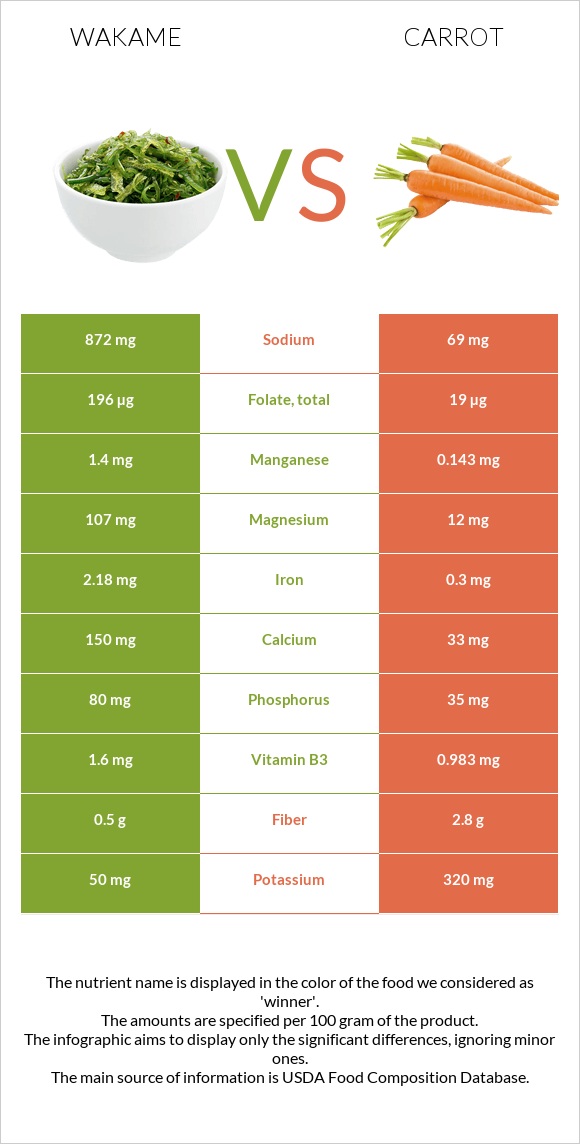
Summary of differences between wakame and carrots Wakame has more manganese, folate, copper, iron, magnesium, vitamin B2, and calcium; however, carrots are higher in vitamin A and vitamin B6. Carrots cover your daily need for vitamin A, 327% more than wakame. Wakame has 13 times more sodium than carrots. While wakame has 872mg of sodium, carrots have only 69mg. These are the specific foods used in this comparison Seaweed, wakame, raw and Carrots, raw .
Infographic
Mineral Comparison
Mineral comparison score is based on the number of minerals by which one or the other food is richer. The "coverage" charts below show how much of the daily needs can be covered by 300 grams of the food.
8
100 g
300 g
2 tbsp (1/8 cup) - 10g
Magnesium
Magnesium
Calcium
Calcium
Potassium
Potassium
Iron
Iron
Copper
Copper
Zinc
Zinc
Phosphorus
Phosphorus
Sodium
Sodium
Manganese
Manganese
Selenium
Selenium
76%
45%
4.4%
82%
95%
10%
34%
114%
183%
3.8%
2
100 g
300 g
1 slice - 3g 1 strip medium - 4g 1 strip large (3" long) - 7g 1 small (5-1/2" long) - 50g 1 medium - 61g 1 large (7-1/4" to 8-/1/2" long) - 72g 1 cup grated - 110g 1 cup strips or slices - 122g 1 cup chopped - 128g
Magnesium
Magnesium
Calcium
Calcium
Potassium
Potassium
Iron
Iron
Copper
Copper
Zinc
Zinc
Phosphorus
Phosphorus
Sodium
Sodium
Manganese
Manganese
Selenium
Selenium
8.6%
9.9%
28%
11%
15%
6.5%
15%
9%
19%
0.55%
Vitamin Comparison
Vitamin comparison score is based on the number of vitamins by which one or the other food is richer. The "coverage" charts below show how much of the daily needs can be covered by 300 grams of the food.
5
100 g
300 g
2 tbsp (1/8 cup) - 10g
Vitamin C
Vit. C
Vitamin D
Vit. D
Vitamin A
Vit. A
Vitamin E
Vit. E
Vitamin B1
Vit. B1
Vitamin B2
Vit. B2
Vitamin B3
Vit. B3
Vitamin B5
Vit. B5
Vitamin B6
Vit. B6
Vitamin B12
Vit. B12
Vitamin K
Vit. K
Folate
Folate
10%
0%
6%
20%
15%
53%
30%
42%
0.46%
0%
13%
147%
4
100 g
300 g
1 slice - 3g 1 strip medium - 4g 1 strip large (3" long) - 7g 1 small (5-1/2" long) - 50g 1 medium - 61g 1 large (7-1/4" to 8-/1/2" long) - 72g 1 cup grated - 110g 1 cup strips or slices - 122g 1 cup chopped - 128g
Vitamin C
Vit. C
Vitamin D
Vit. D
Vitamin A
Vit. A
Vitamin E
Vit. E
Vitamin B1
Vit. B1
Vitamin B2
Vit. B2
Vitamin B3
Vit. B3
Vitamin B5
Vit. B5
Vitamin B6
Vit. B6
Vitamin B12
Vit. B12
Vitamin K
Vit. K
Folate
Folate
20%
0%
278%
13%
17%
13%
18%
16%
32%
0%
33%
14%
All nutrients comparison - raw data values
Nutrient
DV% diff.
Vitamin A
18µg
835µg
91%
Manganese
1.4mg
0.143mg
55%
Folate
196µg
19µg
44%
Sodium
872mg
69mg
35%
Copper
0.284mg
0.045mg
27%
Iron
2.18mg
0.3mg
24%
Magnesium
107mg
12mg
23%
Vitamin B2
0.23mg
0.058mg
13%
Calcium
150mg
33mg
12%
Vitamin B6
0.002mg
0.138mg
10%
Fiber
0.5g
2.8g
9%
Potassium
50mg
320mg
8%
Vitamin B5
0.697mg
0.273mg
8%
Vitamin K
5.3µg
13.2µg
7%
Phosphorus
80mg
35mg
6%
Protein
3.03g
0.93g
4%
Vitamin B3
1.6mg
0.983mg
4%
Vitamin C
3mg
5.9mg
3%
Vitamin E
1mg
0.66mg
2%
Fats
0.64g
0.24g
1%
Zinc
0.38mg
0.24mg
1%
Starch
1.43g
1%
Selenium
0.7µg
0.1µg
1%
Vitamin B1
0.06mg
0.066mg
1%
Choline
13.9mg
8.8mg
1%
Polyunsaturated fat
0.218g
0.117g
1%
Fructose
0.55g
1%
Calories
45kcal
41kcal
0%
Protein per 100 calories
6.7g
2.3g
N/A
Calories per 10 g protein
149kcal
441kcal
N/A
Weight per 100 calories
222g
244g
N/A
Net carbs
8.64g
6.78g
N/A
Carbs
9.14g
9.58g
0%
Sugar
0.65g
4.74g
N/A
Saturated fat
0.13g
0.037g
0%
Monounsaturated fat
0.058g
0.014g
0%
Tryptophan
0.035mg
0.012mg
0%
Threonine
0.165mg
0.191mg
0%
Isoleucine
0.087mg
0.077mg
0%
Leucine
0.257mg
0.102mg
0%
Lysine
0.112mg
0.101mg
0%
Methionine
0.063mg
0.02mg
0%
Phenylalanine
0.112mg
0.061mg
0%
Valine
0.209mg
0.069mg
0%
Histidine
0.015mg
0.04mg
0%
Omega-3 - EPA
0.186g
0g
N/A
Macronutrient Comparison
Macronutrient breakdown side-by-side comparison
3
3%
9%
80%
7%
Protein:
3.03 g
Fats:
0.64 g
Carbs:
9.14 g
Water:
79.99 g
Other:
7.2 g
2
10%
88%
Protein:
0.93 g
Fats:
0.24 g
Carbs:
9.58 g
Water:
88.29 g
Other:
0.96 g
Contains
more
Protein Protein
+225.8%
Contains
more
Fats Fats
+166.7%
Contains
more
Other Other
+650%
Contains
more
Water Water
+10.4%
Fat Type Comparison
Fat type breakdown side-by-side comparison
2
32%
14%
54%
Saturated fat:
Sat. Fat
0.13 g
Monounsaturated fat:
Mono. Fat
0.058 g
Polyunsaturated fat:
Poly. Fat
0.218 g
1
22%
8%
70%
Saturated fat:
Sat. Fat
0.037 g
Monounsaturated fat:
Mono. Fat
0.014 g
Polyunsaturated fat:
Poly. Fat
0.117 g
Contains
more
Mono. Fat Monounsaturated fat
+314.3%
Contains
more
Poly. Fat Polyunsaturated fat
+86.3%
Contains
less
Sat. Fat Saturated fat
-71.5%