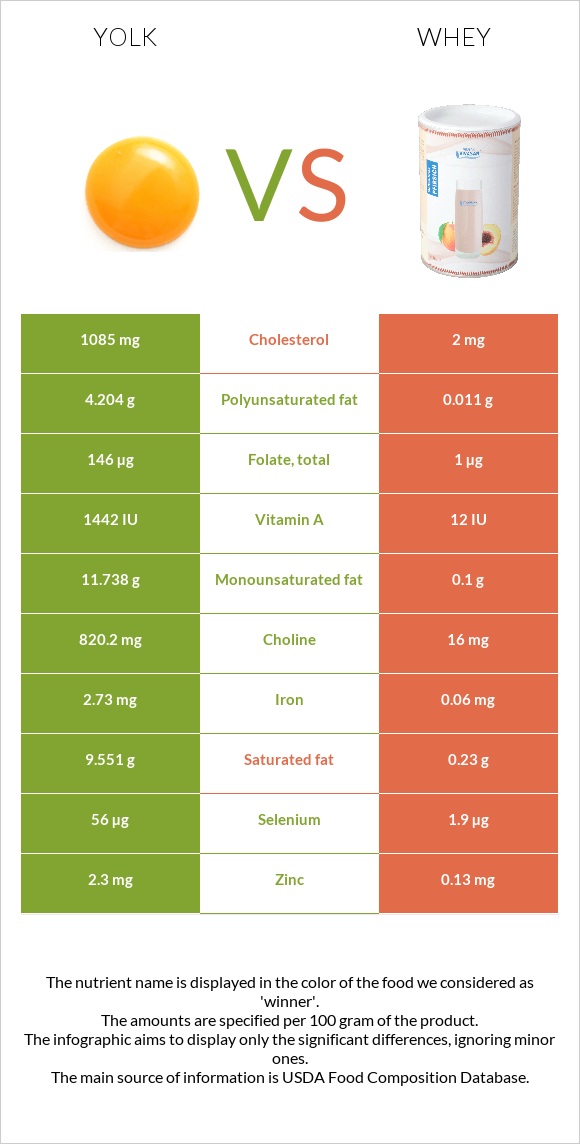
How are yolk and whey different? Yolk has more choline, selenium, vitamin B12, vitamin B5, phosphorus, folate, iron, and vitamin A than whey. Daily need coverage for cholesterol for yolk is 361% higher. Yolk contains 146 times more folate than whey. While yolk contains 146µg of folate, whey contains only 1µg. Whey has less cholesterol. Yolk has a lower glycemic index (0) than whey (43). Egg, yolk, raw, fresh and Whey, sweet, fluid are the varieties used in this article.
Infographic
Mineral Comparison
Mineral comparison score is based on the number of minerals by which one or the other food is richer. The "coverage" charts below show how much of the daily needs can be covered by 300 grams of the food.
8
100 g
300 g
1 large - 17g 1 cup - 243g
Magnesium
Magnesium
Calcium
Calcium
Potassium
Potassium
Iron
Iron
Copper
Copper
Zinc
Zinc
Phosphorus
Phosphorus
Sodium
Sodium
Manganese
Manganese
Selenium
Selenium
3.6%
39%
9.6%
102%
26%
63%
167%
6.3%
7.2%
305%
2
100 g
300 g
1 cup - 246g 1 quart - 984g
Magnesium
Magnesium
Calcium
Calcium
Potassium
Potassium
Iron
Iron
Copper
Copper
Zinc
Zinc
Phosphorus
Phosphorus
Sodium
Sodium
Manganese
Manganese
Selenium
Selenium
5.7%
14%
14%
2.3%
1.3%
3.5%
20%
7%
0.13%
10%
Vitamin Comparison
Vitamin comparison score is based on the number of vitamins by which one or the other food is richer. The "coverage" charts below show how much of the daily needs can be covered by 300 grams of the food.
10
100 g
300 g
1 large - 17g 1 cup - 243g
Vitamin C
Vit. C
Vitamin D
Vit. D
Vitamin A
Vit. A
Vitamin E
Vit. E
Vitamin B1
Vit. B1
Vitamin B2
Vit. B2
Vitamin B3
Vit. B3
Vitamin B5
Vit. B5
Vitamin B6
Vit. B6
Vitamin B12
Vit. B12
Vitamin K
Vit. K
Folate
Folate
0%
81%
127%
52%
44%
122%
0.45%
179%
81%
244%
1.8%
110%
2
100 g
300 g
1 cup - 246g 1 quart - 984g
Vitamin C
Vit. C
Vitamin D
Vit. D
Vitamin A
Vit. A
Vitamin E
Vit. E
Vitamin B1
Vit. B1
Vitamin B2
Vit. B2
Vitamin B3
Vit. B3
Vitamin B5
Vit. B5
Vitamin B6
Vit. B6
Vitamin B12
Vit. B12
Vitamin K
Vit. K
Folate
Folate
0.33%
0%
1%
0%
9%
36%
1.4%
23%
7.2%
35%
0%
0.75%
All nutrients comparison - raw data values
Nutrient
DV% diff.
Cholesterol
1085mg
2mg
361%
Choline
820.2mg
16mg
146%
Selenium
56µg
1.9µg
98%
Vitamin B12
1.95µg
0.28µg
70%
Vitamin B5
2.99mg
0.383mg
52%
Phosphorus
390mg
46mg
49%
Vitamin A
381µg
3µg
42%
Saturated fat
9.551g
0.23g
42%
Fats
26.54g
0.36g
40%
Folate
146µg
1µg
36%
Iron
2.73mg
0.06mg
33%
Protein
15.86g
0.85g
30%
Monounsaturated fat
11.738g
0.1g
29%
Vitamin B2
0.528mg
0.158mg
28%
Polyunsaturated fat
4.204g
0.011g
28%
Vitamin D*
218 IU
27%
Vitamin D
5.4µg
27%
Vitamin B6
0.35mg
0.031mg
25%
Zinc
2.3mg
0.13mg
20%
Vitamin E
2.58mg
0mg
17%
Calories
322kcal
27kcal
15%
Vitamin B1
0.176mg
0.036mg
12%
Calcium
129mg
47mg
8%
Copper
0.077mg
0.004mg
8%
Potassium
109mg
161mg
2%
Manganese
0.055mg
0.001mg
2%
Carbs
3.59g
5.14g
1%
Magnesium
5mg
8mg
1%
Vitamin K
0.7µg
0µg
1%
Protein per 100 calories
4.9g
3.1g
N/A
Calories per 10 g protein
203kcal
318kcal
N/A
Weight per 100 calories
31g
370g
N/A
Unsaturated / Saturated Fat ratio
1.7
0.48
N/A
Vitamin C
0mg
0.1mg
0%
Net carbs
3.59g
5.14g
N/A
Sugar
0.56g
5.14g
N/A
Sodium
48mg
54mg
0%
Vitamin B3
0.024mg
0.074mg
0%
Tryptophan
0.177mg
0.013mg
0%
Threonine
0.687mg
0.054mg
0%
Isoleucine
0.866mg
0.047mg
0%
Leucine
1.399mg
0.078mg
0%
Lysine
1.217mg
0.068mg
0%
Methionine
0.378mg
0.016mg
0%
Phenylalanine
0.681mg
0.027mg
0%
Valine
0.949mg
0.046mg
0%
Histidine
0.416mg
0.016mg
0%
Fructose
0.07g
0%
Omega-3 - EPA
0.011g
0g
N/A
Omega-3 - DHA
0.114g
0g
N/A
Macronutrient Comparison
Macronutrient breakdown side-by-side comparison
3
16%
27%
4%
52%
2%
Protein:
15.86 g
Fats:
26.54 g
Carbs:
3.59 g
Water:
52.31 g
Other:
1.7 g
2
5%
93%
Protein:
0.85 g
Fats:
0.36 g
Carbs:
5.14 g
Water:
93.12 g
Other:
0.53 g
Contains
more
Protein Protein
+1765.9%
Contains
more
Fats Fats
+7272.2%
Contains
more
Other Other
+220.8%
Contains
more
Carbs Carbs
+43.2%
Contains
more
Water Water
+78%
Fat Type Comparison
Fat type breakdown side-by-side comparison
2
37%
46%
16%
Saturated fat:
Sat. Fat
9.551 g
Monounsaturated fat:
Mono. Fat
11.738 g
Polyunsaturated fat:
Poly. Fat
4.204 g
1
67%
29%
3%
Saturated fat:
Sat. Fat
0.23 g
Monounsaturated fat:
Mono. Fat
0.1 g
Polyunsaturated fat:
Poly. Fat
0.011 g
Contains
more
Mono. Fat Monounsaturated fat
+11638%
Contains
more
Poly. Fat Polyunsaturated fat
+38118.2%
Contains
less
Sat. Fat Saturated fat
-97.6%