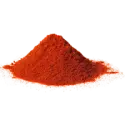
Paprika nutrition: calories, carbs, GI, protein, fiber, fats
Carbs in paprika
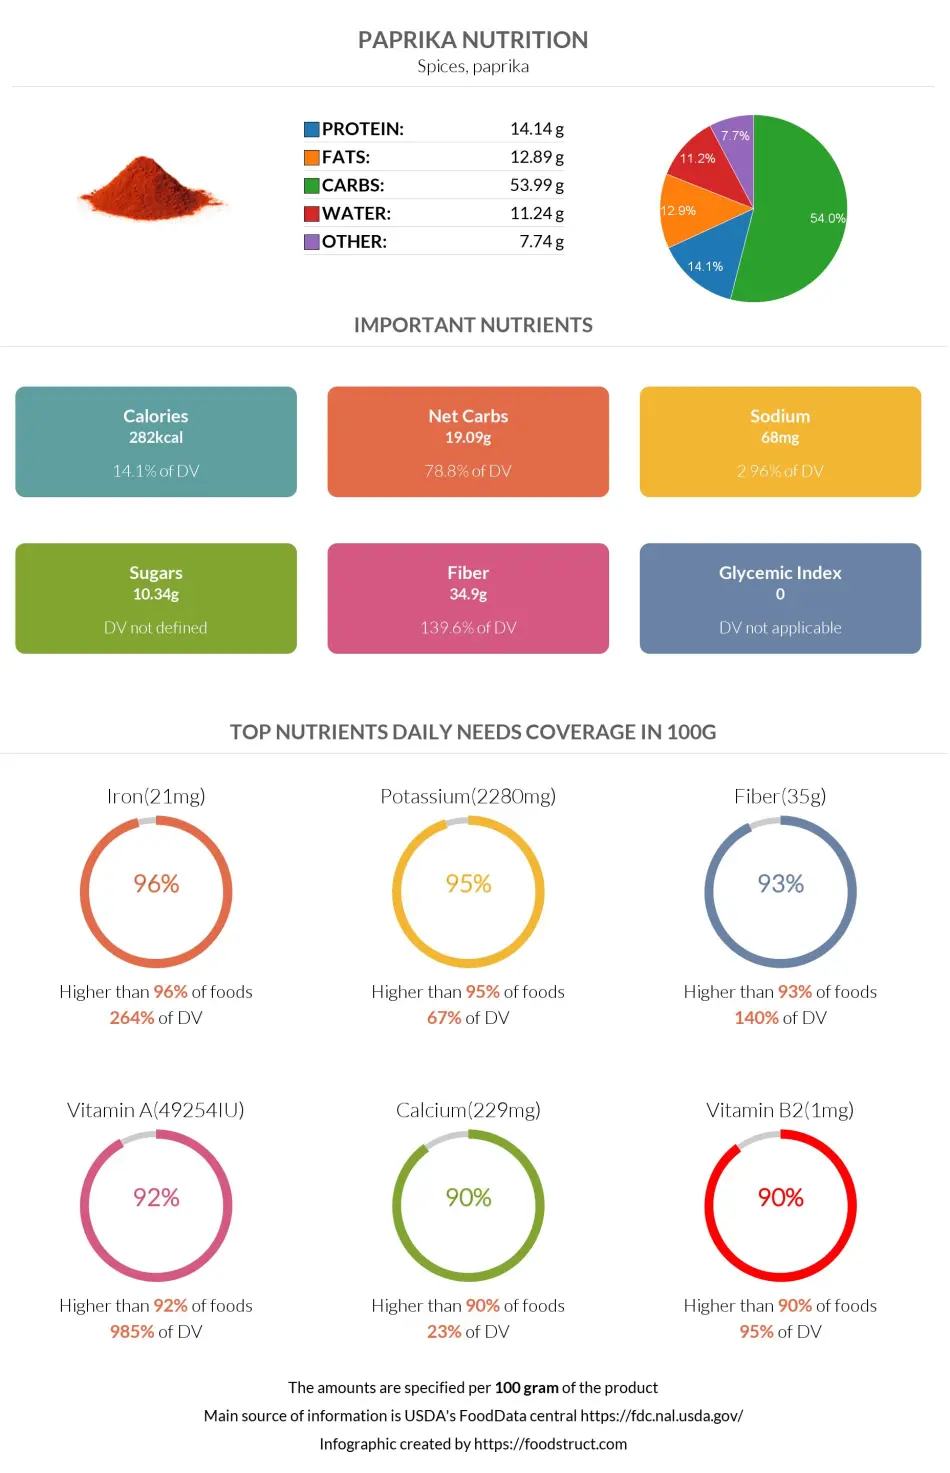
Paprika, as dried spices, are mainly composed of carbohydrates. The total carbs of 100g of paprika are equal to 54g.
However, it is essential to note that people usually consume a tiny amount of paprika, and the carbs number can vary depending on intake.
We can visualize the macronutrient distribution focusing on the total carbohydrates in the below chart.
Macronutrients chart
Carbs per serving size
One serving size of paprika equals 0.5g since it is a spice. It is equivalent to 0.25 tsp.
The total carbohydrate content of one serving size of paprika is equivalent to 0.27g of carbs.
In addition to that, the net carbs in one serving of paprika are equivalent to 0.095g.
Carbohydrate type breakdown
The carbohydrates in paprika are distributed among fructose, glucose, and sucrose.
The highest distribution is for fructose. It is also important to mention that starch is absent from the distribution of carbs in paprika.
Carbohydrate type breakdown
Net carbs in paprika
The net carbs in paprika is equal to 19.09g per 100g of paprika.
Considering they are spices and are usually eaten in amounts that are less than 1g, they won't contribute to carbs in high amounts in meals.
Fiber in paprika
Per 100g of paprika, 35g of fibers is nearly 140% of the DV. However, per serving size equivalent to 0.5g, the fiber content is 0.17g.
Fiber content ratio for Paprika
Comparison to other foods
The table below compares paprika to similar spices, with carbohydrate content as a variable.
| Food | Carbohydrates (per serving) | Carbohydrates per 100g |
| Paprika | 0.27g (0.5g) | 54g |
| Black pepper | 0.32g (0.5g) | 64g |
| Curry | 0.28g (0.5g) | 56g |
| Allspice | 0.36g (110g) | 72g |

Important nutritional characteristics for Paprika
|
Glycemic index ⓘ
Source: 117 with butter and rice (butter and rice 100) https://www.jstage.jst.go.jp/article/fstr/11/1/11_1_77/_pdf
Check out our Glycemic index chart page for the full list.
|
0 (low) |
| Calories ⓘ Calories per 100-gram serving | 282 |
| Net Carbs ⓘ Net Carbs = Total Carbohydrates – Fiber – Sugar Alcohols | 19.09 grams |
| Serving Size ⓘ Serving sizes are taken from FDA's Reference Amounts Customarily Consumed (RACCs) | 0.25 tsp (0.5 grams) |
| Acidity (Based on PRAL) ⓘ PRAL (Potential renal acid load) is calculated using a formula. On the PRAL scale the higher the positive value, the more is the acidifying effect on the body. The lower the negative value, the higher the alkalinity of the food. 0 is neutral. | -36.9 (alkaline) |
| Oxalates ⓘ https://www.researchgate.net/publication/305495290 | more than 300mg |
Paprika calories (kcal)
| Serving Size | Calories | Weight |
|---|---|---|
| Calories in 100 grams | 282 | |
| Calories in 0.25 tsp | 1 | 0.5 g |
| Calories in 1 tbsp | 19 | 6.8 g |
Paprika Glycemic index (GI)
Mineral coverage chart
Mineral chart - relative view
Vitamin coverage chart
Vitamin chart - relative view
Protein quality breakdown
Fat type information
All nutrients for Paprika per 100g
| Nutrient | Value | DV% | In TOP % of foods | Comparison |
| Calories | 282kcal | 14% | 32% |
6 times more than Orange
|
| Protein | 14.14g | 34% | 35% |
5 times more than Broccoli
|
| Fats | 12.89g | 20% | 27% |
2.6 times less than Cheddar Cheese
|
| Vitamin C | 0.9mg | 1% | 43% |
58.9 times less than Lemon
|
| Net carbs | 19.09g | N/A | 33% |
2.8 times less than Chocolate
|
| Carbs | 53.99g | 18% | 19% |
1.9 times more than Rice
|
| Cholesterol | 0mg | 0% | 100% |
N/A
|
| Vitamin D | 0µg | 0% | 100% |
N/A
|
| Iron | 21.14mg | 264% | 4% |
8.1 times more than Beef broiled
|
| Calcium | 229mg | 23% | 10% |
1.8 times more than Milk
|
| Potassium | 2280mg | 67% | 5% |
15.5 times more than Cucumber
|
| Magnesium | 178mg | 42% | 11% |
1.3 times more than Almond
|
| Sugar | 10.34g | N/A | 39% |
1.2 times more than Coca-Cola
|
| Fiber | 34.9g | 140% | 7% |
14.5 times more than Orange
|
| Copper | 0.71mg | 79% | 18% |
5 times more than Shiitake
|
| Zinc | 4.33mg | 39% | 22% |
1.5 times less than Beef broiled
|
| Phosphorus | 314mg | 45% | 15% |
1.7 times more than Chicken meat
|
| Sodium | 68mg | 3% | 59% |
7.2 times less than White Bread
|
| Vitamin A | 49254IU | 985% | 8% |
2.9 times more than Carrot
|
| Vitamin A RAE | 2463µg | 274% | 18% | |
| Vitamin E | 29.1mg | 194% | 33% |
19.9 times more than Kiwifruit
|
| Selenium | 6.3µg | 11% | 65% | |
| Manganese | 1.59mg | 69% | 29% | |
| Vitamin B1 | 0.33mg | 28% | 25% |
1.2 times more than Pea raw
|
| Vitamin B2 | 1.23mg | 95% | 10% |
9.5 times more than Avocado
|
| Vitamin B3 | 10.06mg | 63% | 12% |
1.1 times more than Turkey meat
|
| Vitamin B5 | 2.51mg | 50% | 27% |
2.2 times more than Sunflower seed
|
| Vitamin B6 | 2.14mg | 165% | 11% |
18 times more than Oat
|
| Vitamin B12 | 0µg | 0% | 100% |
N/A
|
| Vitamin K | 80.3µg | 67% | 43% |
1.3 times less than Broccoli
|
| Folate | 49µg | 12% | 35% |
1.2 times less than Brussels sprout
|
| Trans Fat | 0g | N/A | 100% |
N/A
|
| Saturated Fat | 2.14g | 11% | 45% |
2.8 times less than Beef broiled
|
| Monounsaturated Fat | 1.7g | N/A | 56% |
5.8 times less than Avocado
|
| Polyunsaturated fat | 7.77g | N/A | 14% |
6.1 times less than Walnut
|
| Tryptophan | 0.07mg | 0% | 83% |
4.4 times less than Chicken meat
|
| Threonine | 0.49mg | 0% | 73% |
1.5 times less than Beef broiled
|
| Isoleucine | 0.57mg | 0% | 72% |
1.6 times less than Salmon raw
|
| Leucine | 0.92mg | 0% | 74% |
2.6 times less than Tuna Bluefin
|
| Lysine | 0.69mg | 0% | 74% |
1.5 times more than Tofu
|
| Methionine | 0.2mg | 0% | 75% |
2.1 times more than Quinoa
|
| Phenylalanine | 0.61mg | 0% | 72% |
1.1 times less than Egg
|
| Valine | 0.75mg | 0% | 70% |
2.7 times less than Soybean raw
|
| Histidine | 0.25mg | 0% | 76% |
3 times less than Turkey meat
|
| Fructose | 6.71g | 8% | 81% |
1.1 times more than Apple
|
| Omega-3 - EPA | 0g | N/A | 100% |
N/A
|
| Omega-3 - DHA | 0g | N/A | 100% |
N/A
|
| Omega-3 - ALA | 0.45g | N/A | 80% |
20.2 times less than Canola oil
|
| Omega-3 - DPA | 0g | N/A | 100% |
N/A
|
| Omega-6 - Gamma-linoleic acid | 0g | N/A | 100% | |
| Omega-6 - Eicosadienoic acid | 0g | N/A | 100% |
Check out similar food or compare with current
NUTRITION FACTS LABEL
Serving Size ______________
Health checks
Paprika nutrition infographic
References
All the values for which the sources are not specified explicitly are taken from FDA’s Food Central. The exact link to the food presented on this page can be found below.