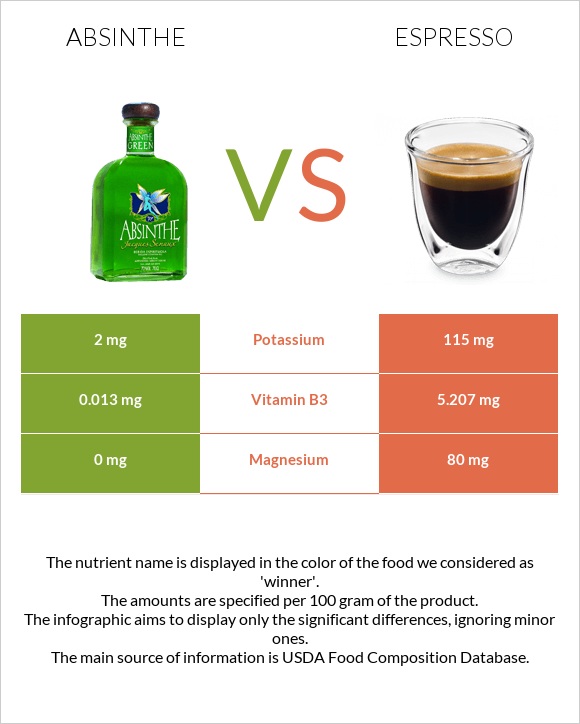
Summary of differences between absinthe and espresso The amount of vitamin B3, magnesium, and vitamin B2 in espresso is higher than in absinthe. Espresso covers your daily need for vitamin B3, 32% more than absinthe. These are the specific foods used in this comparison Alcoholic beverage, distilled, all (gin, rum, vodka, whiskey) 100 proof and Beverages, coffee, brewed, espresso, restaurant-prepared .
Infographic
Mineral Comparison
Mineral comparison score is based on the number of minerals by which one or the other food is richer. The "coverage" charts below show how much of the daily needs can be covered by 300 grams of the food.
1
100 g
300 g
1 fl oz - 27.8g 1.5 fl oz - 42g
Magnesium
Magnesium
Calcium
Calcium
Potassium
Potassium
Iron
Iron
Copper
Copper
Zinc
Zinc
Phosphorus
Phosphorus
Sodium
Sodium
Manganese
Manganese
Selenium
Selenium
0%
0%
0.18%
1.5%
7%
1.1%
1.7%
0.13%
2.3%
0%
8
100 g
300 g
1 fl oz - 29.6g
Magnesium
Magnesium
Calcium
Calcium
Potassium
Potassium
Iron
Iron
Copper
Copper
Zinc
Zinc
Phosphorus
Phosphorus
Sodium
Sodium
Manganese
Manganese
Selenium
Selenium
57%
0.6%
10%
4.9%
17%
1.4%
3%
1.8%
6.5%
0%
Vitamin Comparison
Vitamin comparison score is based on the number of vitamins by which one or the other food is richer. The "coverage" charts below show how much of the daily needs can be covered by 300 grams of the food.
1
100 g
300 g
1 fl oz - 27.8g 1.5 fl oz - 42g
Vitamin C
Vit. C
Vitamin A
Vit. A
Vitamin E
Vit. E
Vitamin D
Vit. D
Vitamin B1
Vit. B1
Vitamin B2
Vit. B2
Vitamin B3
Vit. B3
Vitamin B5
Vit. B5
Vitamin B6
Vit. B6
Vitamin B12
Vit. B12
Vitamin K
Vit. K
Folate
Folate
0%
0%
0%
0%
1.5%
0.92%
0.24%
0%
0.23%
0%
0%
0%
8
100 g
300 g
1 fl oz - 29.6g
Vitamin C
Vit. C
Vitamin A
Vit. A
Vitamin E
Vit. E
Vitamin D
Vit. D
Vitamin B1
Vit. B1
Vitamin B2
Vit. B2
Vitamin B3
Vit. B3
Vitamin B5
Vit. B5
Vitamin B6
Vit. B6
Vitamin B12
Vit. B12
Vitamin K
Vit. K
Folate
Folate
0.67%
0%
0.2%
0%
0.25%
41%
98%
1.7%
0.46%
0%
0.25%
0.75%
All nutrients comparison - raw data values
Macronutrient Comparison
Macronutrient breakdown side-by-side comparison
1
58%
43%
Protein:
0 g
Fats:
0 g
Carbs:
0 g
Water:
57.5 g
Other:
42.5 g
4
2%
98%
Protein:
0.12 g
Fats:
0.18 g
Carbs:
1.67 g
Water:
97.8 g
Other:
0.23 g
Contains
more
Other Other
+18378.3%
Contains
more
Protein Protein
+∞%
Contains
more
Fats Fats
+∞%
Contains
more
Carbs Carbs
+∞%
Contains
more
Water Water
+70.1%