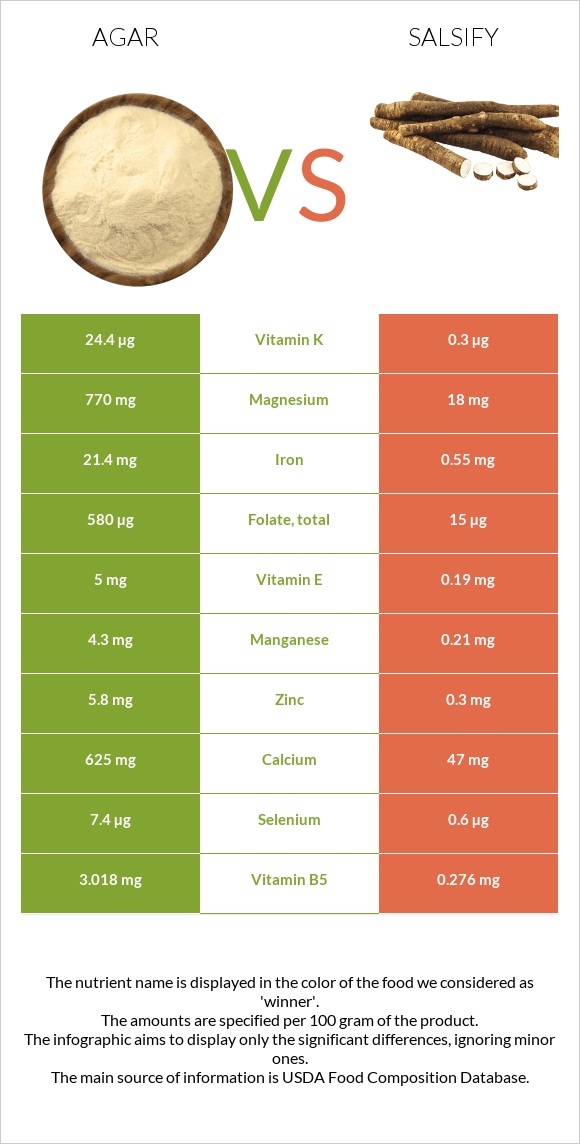
Differences between agar and salsify Salsify contains less iron, magnesium, manganese, folate, copper, calcium, vitamin B5, zinc, vitamin E, and potassium than agar. Agar's daily need coverage for iron is 261% higher. Salsify contains 43 times less magnesium than agar. Agar contains 770mg of magnesium, while salsify contains 18mg. The food types used in this comparison are Seaweed, agar, dried and Salsify, cooked, boiled, drained, without salt .
Infographic
Mineral Comparison
Mineral comparison score is based on the number of minerals by which one or the other food is richer. The "coverage" charts below show how much of the daily needs can be covered by 300 grams of the food.
8
100 g
300 g
Magnesium
Magnesium
Calcium
Calcium
Potassium
Potassium
Iron
Iron
Copper
Copper
Zinc
Zinc
Phosphorus
Phosphorus
Sodium
Sodium
Manganese
Manganese
Selenium
Selenium
550%
188%
99%
803%
203%
158%
22%
13%
561%
40%
1
100 g
300 g
1 cup, sliced - 135g
Magnesium
Magnesium
Calcium
Calcium
Potassium
Potassium
Iron
Iron
Copper
Copper
Zinc
Zinc
Phosphorus
Phosphorus
Sodium
Sodium
Manganese
Manganese
Selenium
Selenium
13%
14%
25%
21%
23%
8.2%
24%
2.1%
27%
3.3%
Vitamin Comparison
Vitamin comparison score is based on the number of vitamins by which one or the other food is richer. The "coverage" charts below show how much of the daily needs can be covered by 300 grams of the food.
6
100 g
300 g
Vitamin C
Vit. C
Vitamin D
Vit. D
Vitamin A
Vit. A
Vitamin E
Vit. E
Vitamin B1
Vit. B1
Vitamin B2
Vit. B2
Vitamin B3
Vit. B3
Vitamin B5
Vit. B5
Vitamin B6
Vit. B6
Vitamin B12
Vit. B12
Vitamin K
Vit. K
Folate
Folate
0%
0%
0%
100%
2.5%
51%
3.8%
181%
70%
0%
61%
435%
3
100 g
300 g
1 cup, sliced - 135g
Vitamin C
Vit. C
Vitamin D
Vit. D
Vitamin A
Vit. A
Vitamin E
Vit. E
Vitamin B1
Vit. B1
Vitamin B2
Vit. B2
Vitamin B3
Vit. B3
Vitamin B5
Vit. B5
Vitamin B6
Vit. B6
Vitamin B12
Vit. B12
Vitamin K
Vit. K
Folate
Folate
15%
0%
0%
3.8%
14%
40%
7.4%
17%
50%
0%
0.75%
11%
All nutrients comparison - raw data values
Nutrient
DV% diff.
Iron
21.4mg
0.55mg
261%
Magnesium
770mg
18mg
179%
Manganese
4.3mg
0.21mg
178%
Folate
580µg
15µg
141%
Copper
0.61mg
0.07mg
60%
Calcium
625mg
47mg
58%
Vitamin B5
3.018mg
0.276mg
55%
Zinc
5.8mg
0.3mg
50%
Vitamin E
5mg
0.19mg
32%
Potassium
1125mg
283mg
25%
Carbs
80.88g
15.36g
22%
Vitamin K
24.4µg
0.3µg
20%
Fiber
7.7g
3.1g
18%
Calories
306kcal
68kcal
12%
Selenium
7.4µg
0.6µg
12%
Protein
6.21g
2.73g
7%
Vitamin B6
0.303mg
0.218mg
7%
Choline
63.3mg
25.9mg
7%
Vitamin C
0mg
4.6mg
5%
Sodium
102mg
16mg
4%
Vitamin B1
0.01mg
0.056mg
4%
Vitamin B2
0.222mg
0.173mg
4%
Phosphorus
52mg
56mg
1%
Vitamin B3
0.202mg
0.392mg
1%
Protein per 100 calories
2g
4g
N/A
Calories per 10 g protein
493kcal
249kcal
N/A
Weight per 100 calories
33g
147g
N/A
Fats
0.3g
0.17g
0%
Net carbs
73.18g
12.26g
N/A
Sugar
2.97g
2.9g
N/A
Saturated fat
0.061g
0.041g
0%
Monounsaturated fat
0.027g
0.003g
0%
Polyunsaturated fat
0.102g
0.074g
0%
Omega-3 - EPA
0.087g
0g
N/A
Macronutrient Comparison
Macronutrient breakdown side-by-side comparison
4
6%
81%
9%
4%
Protein:
6.21 g
Fats:
0.3 g
Carbs:
80.88 g
Water:
8.68 g
Other:
3.93 g
1
3%
15%
81%
Protein:
2.73 g
Fats:
0.17 g
Carbs:
15.36 g
Water:
81 g
Other:
0.74 g
Contains
more
Protein Protein
+127.5%
Contains
more
Fats Fats
+76.5%
Contains
more
Carbs Carbs
+426.6%
Contains
more
Other Other
+431.1%
Contains
more
Water Water
+833.2%
Fat Type Comparison
Fat type breakdown side-by-side comparison
2
32%
14%
54%
Saturated fat:
Sat. Fat
0.061 g
Monounsaturated fat:
Mono. Fat
0.027 g
Polyunsaturated fat:
Poly. Fat
0.102 g
1
35%
3%
63%
Saturated fat:
Sat. Fat
0.041 g
Monounsaturated fat:
Mono. Fat
0.003 g
Polyunsaturated fat:
Poly. Fat
0.074 g
Contains
more
Mono. Fat Monounsaturated fat
+800%
Contains
more
Poly. Fat Polyunsaturated fat
+37.8%
Contains
less
Sat. Fat Saturated fat
-32.8%