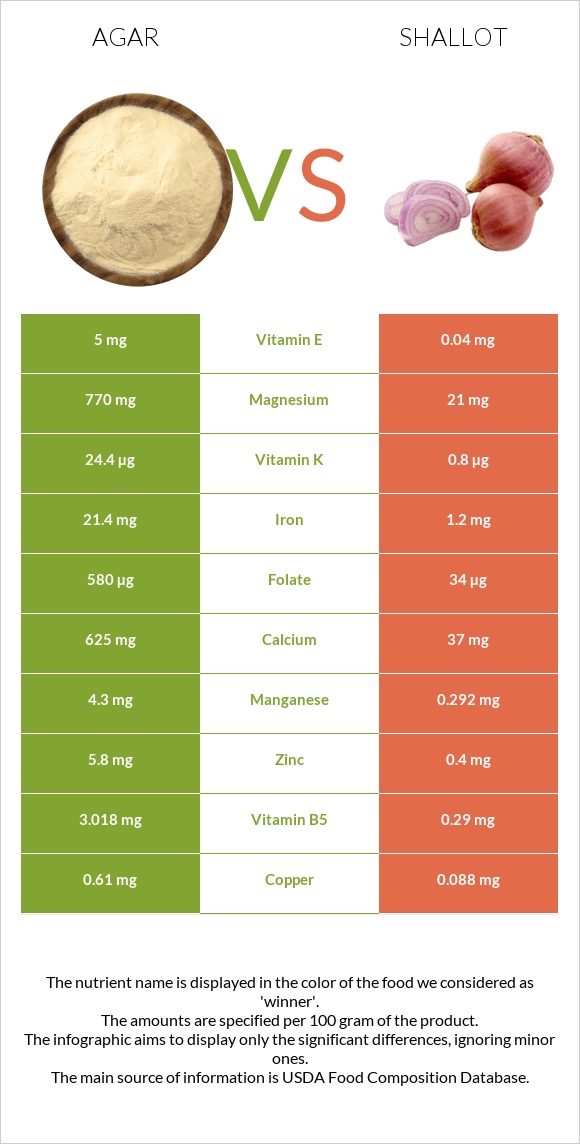
Significant differences between agar and shallots The amount of iron, magnesium, manganese, folate, calcium, copper, vitamin B5, zinc, vitamin E, and potassium in agar is higher than in shallots. Agar covers your daily iron needs 253% more than shallots. Shallots have 125 times less vitamin E than agar. Agar has 5mg of vitamin E, while shallots have 0.04mg. Specific food types used in this comparison are Seaweed, agar, dried and Shallots, raw .
Infographic
Mineral Comparison
Mineral comparison score is based on the number of minerals by which one or the other food is richer. The "coverage" charts below show how much of the daily needs can be covered by 300 grams of the food.
8
100 g
300 g
Magnesium
Magnesium
Calcium
Calcium
Potassium
Potassium
Iron
Iron
Copper
Copper
Zinc
Zinc
Phosphorus
Phosphorus
Sodium
Sodium
Manganese
Manganese
Selenium
Selenium
550%
188%
99%
803%
203%
158%
22%
13%
561%
40%
2
100 g
300 g
1 tbsp chopped - 10g
Magnesium
Magnesium
Calcium
Calcium
Potassium
Potassium
Iron
Iron
Copper
Copper
Zinc
Zinc
Phosphorus
Phosphorus
Sodium
Sodium
Manganese
Manganese
Selenium
Selenium
15%
11%
29%
45%
29%
11%
26%
1.6%
38%
6.5%
Vitamin Comparison
Vitamin comparison score is based on the number of vitamins by which one or the other food is richer. The "coverage" charts below show how much of the daily needs can be covered by 300 grams of the food.
5
100 g
300 g
Vitamin C
Vit. C
Vitamin D
Vit. D
Vitamin A
Vit. A
Vitamin E
Vit. E
Vitamin B1
Vit. B1
Vitamin B2
Vit. B2
Vitamin B3
Vit. B3
Vitamin B5
Vit. B5
Vitamin B6
Vit. B6
Vitamin B12
Vit. B12
Vitamin K
Vit. K
Folate
Folate
0%
0%
0%
100%
2.5%
51%
3.8%
181%
70%
0%
61%
435%
3
100 g
300 g
1 tbsp chopped - 10g
Vitamin C
Vit. C
Vitamin D
Vit. D
Vitamin A
Vit. A
Vitamin E
Vit. E
Vitamin B1
Vit. B1
Vitamin B2
Vit. B2
Vitamin B3
Vit. B3
Vitamin B5
Vit. B5
Vitamin B6
Vit. B6
Vitamin B12
Vit. B12
Vitamin K
Vit. K
Folate
Folate
27%
0%
0%
0.8%
15%
4.6%
3.8%
17%
80%
0%
2%
26%
All nutrients comparison - raw data values
Nutrient
DV% diff.
Iron
21.4mg
1.2mg
253%
Magnesium
770mg
21mg
178%
Manganese
4.3mg
0.292mg
174%
Folate
580µg
34µg
137%
Calcium
625mg
37mg
59%
Copper
0.61mg
0.088mg
58%
Vitamin B5
3.018mg
0.29mg
55%
Zinc
5.8mg
0.4mg
49%
Vitamin E
5mg
0.04mg
33%
Potassium
1125mg
334mg
23%
Carbs
80.88g
16.8g
21%
Vitamin K
24.4µg
0.8µg
20%
Fiber
7.7g
3.2g
18%
Vitamin B2
0.222mg
0.02mg
16%
Calories
306kcal
72kcal
12%
Selenium
7.4µg
1.2µg
11%
Vitamin C
0mg
8mg
9%
Choline
63.3mg
11.3mg
9%
Protein
6.21g
2.5g
7%
Sodium
102mg
12mg
4%
Vitamin B1
0.01mg
0.06mg
4%
Vitamin B6
0.303mg
0.345mg
3%
Phosphorus
52mg
60mg
1%
Protein per 100 calories
2g
3.5g
N/A
Calories per 10 g protein
493kcal
288kcal
N/A
Weight per 100 calories
33g
139g
N/A
Fats
0.3g
0.1g
0%
Net carbs
73.18g
13.6g
N/A
Sugar
2.97g
7.87g
N/A
Vitamin B3
0.202mg
0.2mg
0%
Saturated fat
0.061g
0.017g
0%
Monounsaturated fat
0.027g
0.014g
0%
Polyunsaturated fat
0.102g
0.039g
0%
Tryptophan
0.028mg
0%
Threonine
0.098mg
0%
Isoleucine
0.106mg
0%
Leucine
0.149mg
0%
Lysine
0.125mg
0%
Methionine
0.027mg
0%
Phenylalanine
0.081mg
0%
Valine
0.11mg
0%
Histidine
0.043mg
0%
Omega-3 - EPA
0.087g
0g
N/A
Macronutrient Comparison
Macronutrient breakdown side-by-side comparison
4
6%
81%
9%
4%
Protein:
6.21 g
Fats:
0.3 g
Carbs:
80.88 g
Water:
8.68 g
Other:
3.93 g
1
3%
17%
80%
Protein:
2.5 g
Fats:
0.1 g
Carbs:
16.8 g
Water:
79.8 g
Other:
0.8 g
Contains
more
Protein Protein
+148.4%
Contains
more
Fats Fats
+200%
Contains
more
Carbs Carbs
+381.4%
Contains
more
Other Other
+391.3%
Contains
more
Water Water
+819.4%
Fat Type Comparison
Fat type breakdown side-by-side comparison
2
32%
14%
54%
Saturated fat:
Sat. Fat
0.061 g
Monounsaturated fat:
Mono. Fat
0.027 g
Polyunsaturated fat:
Poly. Fat
0.102 g
1
24%
20%
56%
Saturated fat:
Sat. Fat
0.017 g
Monounsaturated fat:
Mono. Fat
0.014 g
Polyunsaturated fat:
Poly. Fat
0.039 g
Contains
more
Mono. Fat Monounsaturated fat
+92.9%
Contains
more
Poly. Fat Polyunsaturated fat
+161.5%
Contains
less
Sat. Fat Saturated fat
-72.1%