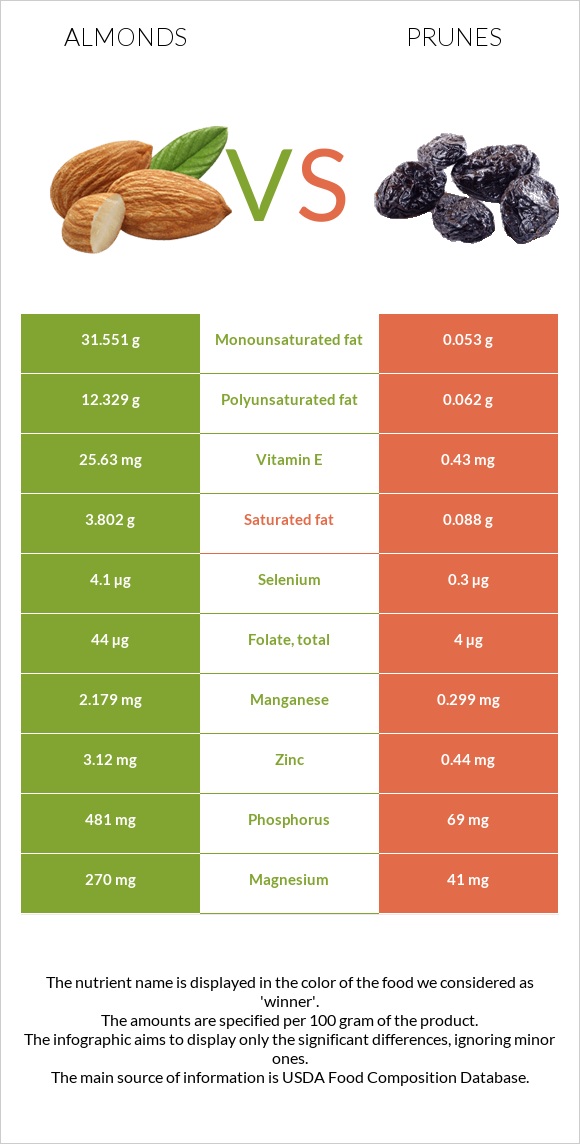
Important differences between almonds and prunes Almonds have more vitamin E, copper, manganese, vitamin B2, phosphorus, magnesium, iron, zinc, and calcium; however, prunes are richer in vitamin K. Almonds' daily need coverage for vitamin E is 168% more. Almonds contain 7 times more manganese than prunes. Almonds contain 2.179mg of manganese, while prunes contain 0.299mg. Prunes have a higher glycemic index. The glycemic index of prunes is 29, while the glycemic index of almonds is 0. The food varieties used in the comparison are Nuts, almonds and Plums, dried (prunes), uncooked .
Infographic
Mineral Comparison
Mineral comparison score is based on the number of minerals by which one or the other food is richer. The "coverage" charts below show how much of the daily needs can be covered by 300 grams of the food.
9
100 g
300 g
1 almond - 1.2g 1 oz (23 whole kernels) - 28.35g 1 cup, sliced - 92g 1 cup, ground - 95g 1 cup, slivered - 108g 1 cup, whole - 143g
Magnesium
Magnesium
Calcium
Calcium
Potassium
Potassium
Iron
Iron
Copper
Copper
Zinc
Zinc
Phosphorus
Phosphorus
Sodium
Sodium
Manganese
Manganese
Selenium
Selenium
193%
81%
65%
139%
344%
85%
206%
0.13%
284%
22%
0
100 g
300 g
1 prune, pitted - 9.5g 1 cup, pitted - 174g
Magnesium
Magnesium
Calcium
Calcium
Potassium
Potassium
Iron
Iron
Copper
Copper
Zinc
Zinc
Phosphorus
Phosphorus
Sodium
Sodium
Manganese
Manganese
Selenium
Selenium
29%
13%
65%
35%
94%
12%
30%
0.26%
39%
1.6%
Vitamin Comparison
Vitamin comparison score is based on the number of vitamins by which one or the other food is richer. The "coverage" charts below show how much of the daily needs can be covered by 300 grams of the food.
6
100 g
300 g
1 almond - 1.2g 1 oz (23 whole kernels) - 28.35g 1 cup, sliced - 92g 1 cup, ground - 95g 1 cup, slivered - 108g 1 cup, whole - 143g
Vitamin C
Vit. C
Vitamin D
Vit. D
Vitamin A
Vit. A
Vitamin E
Vit. E
Vitamin B1
Vit. B1
Vitamin B2
Vit. B2
Vitamin B3
Vit. B3
Vitamin B5
Vit. B5
Vitamin B6
Vit. B6
Vitamin B12
Vit. B12
Vitamin K
Vit. K
Folate
Folate
0%
0%
0%
513%
51%
263%
68%
28%
32%
0%
0%
33%
4
100 g
300 g
1 prune, pitted - 9.5g 1 cup, pitted - 174g
Vitamin C
Vit. C
Vitamin D
Vit. D
Vitamin A
Vit. A
Vitamin E
Vit. E
Vitamin B1
Vit. B1
Vitamin B2
Vit. B2
Vitamin B3
Vit. B3
Vitamin B5
Vit. B5
Vitamin B6
Vit. B6
Vitamin B12
Vit. B12
Vitamin K
Vit. K
Folate
Folate
2%
0%
13%
8.6%
13%
43%
35%
25%
47%
0%
149%
3%
All nutrients comparison - raw data values
Nutrient
DV% diff.
Vitamin E
25.63mg
0.43mg
168%
Copper
1.031mg
0.281mg
83%
Manganese
2.179mg
0.299mg
82%
Polyunsaturated fat
12.329g
0.062g
82%
Monounsaturated fat
31.551g
0.053g
79%
Fats
49.93g
0.38g
76%
Vitamin B2
1.138mg
0.186mg
73%
Phosphorus
481mg
69mg
59%
Magnesium
270mg
41mg
55%
Vitamin K
0µg
59.5µg
50%
Protein
21.15g
2.18g
38%
Iron
3.71mg
0.93mg
35%
Zinc
3.12mg
0.44mg
24%
Calcium
269mg
43mg
23%
Fiber
12.5g
7.1g
22%
Calories
579kcal
240kcal
17%
Saturated fat
3.802g
0.088g
17%
Fructose
0.11g
12.45g
15%
Carbs
21.55g
63.88g
14%
Vitamin B1
0.205mg
0.051mg
13%
Vitamin B3
3.618mg
1.882mg
11%
Folate
44µg
4µg
10%
Choline
52.1mg
10.1mg
8%
Selenium
4.1µg
0.3µg
7%
Vitamin B6
0.137mg
0.205mg
5%
Vitamin A
0µg
39µg
4%
Starch
0.72g
5.11g
2%
Vitamin C
0mg
0.6mg
1%
Vitamin B5
0.471mg
0.422mg
1%
Protein per 100 calories
3.7g
0.91g
N/A
Calories per 10 g protein
274kcal
1101kcal
N/A
Weight per 100 calories
17g
42g
N/A
Unsaturated / Saturated Fat ratio
12
1.3
N/A
Net carbs
9.05g
56.78g
N/A
Potassium
733mg
732mg
0%
Sugar
4.35g
38.13g
N/A
Sodium
1mg
2mg
0%
Trans fat
0.015g
N/A
Tryptophan
0.211mg
0.025mg
0%
Threonine
0.601mg
0.049mg
0%
Isoleucine
0.751mg
0.041mg
0%
Leucine
1.473mg
0.066mg
0%
Lysine
0.568mg
0.05mg
0%
Methionine
0.157mg
0.016mg
0%
Phenylalanine
1.132mg
0.052mg
0%
Valine
0.855mg
0.056mg
0%
Histidine
0.539mg
0.027mg
0%
Omega-3 - ALA
0.003g
N/A
Omega-6 - Eicosadienoic acid
0.002g
0g
N/A
Omega-6 - Linoleic acid
12.32g
N/A
Macronutrient Comparison
Macronutrient breakdown side-by-side comparison
3
21%
50%
22%
4%
3%
Protein:
21.15 g
Fats:
49.93 g
Carbs:
21.55 g
Water:
4.41 g
Other:
2.96 g
2
2%
64%
31%
3%
Protein:
2.18 g
Fats:
0.38 g
Carbs:
63.88 g
Water:
30.92 g
Other:
2.64 g
Contains
more
Protein Protein
+870.2%
Contains
more
Fats Fats
+13039.5%
Contains
more
Other Other
+12.1%
Contains
more
Carbs Carbs
+196.4%
Contains
more
Water Water
+601.1%
Fat Type Comparison
Fat type breakdown side-by-side comparison
2
8%
66%
26%
Saturated fat:
Sat. Fat
3.802 g
Monounsaturated fat:
Mono. Fat
31.551 g
Polyunsaturated fat:
Poly. Fat
12.329 g
1
43%
26%
31%
Saturated fat:
Sat. Fat
0.088 g
Monounsaturated fat:
Mono. Fat
0.053 g
Polyunsaturated fat:
Poly. Fat
0.062 g
Contains
more
Mono. Fat Monounsaturated fat
+59430.2%
Contains
more
Poly. Fat Polyunsaturated fat
+19785.5%
Contains
less
Sat. Fat Saturated fat
-97.7%
Carbohydrate type comparison
Carbohydrate type breakdown side-by-side comparison
2
14%
78%
3%
2%
Starch:
0.72 g
Sucrose:
3.95 g
Glucose:
0.17 g
Fructose:
0.11 g
Lactose:
0 g
Maltose:
0.04 g
Galactose:
0.07 g
4
12%
59%
29%
Starch:
5.11 g
Sucrose:
0.15 g
Glucose:
25.46 g
Fructose:
12.45 g
Lactose:
0 g
Maltose:
0.06 g
Galactose:
0 g
Contains
more
Sucrose Sucrose
+2533.3%
Contains
more
Galactose Galactose
+∞%
Contains
more
Starch Starch
+609.7%
Contains
more
Glucose Glucose
+14876.5%
Contains
more
Fructose Fructose
+11218.2%
Contains
more
Maltose Maltose
+50%