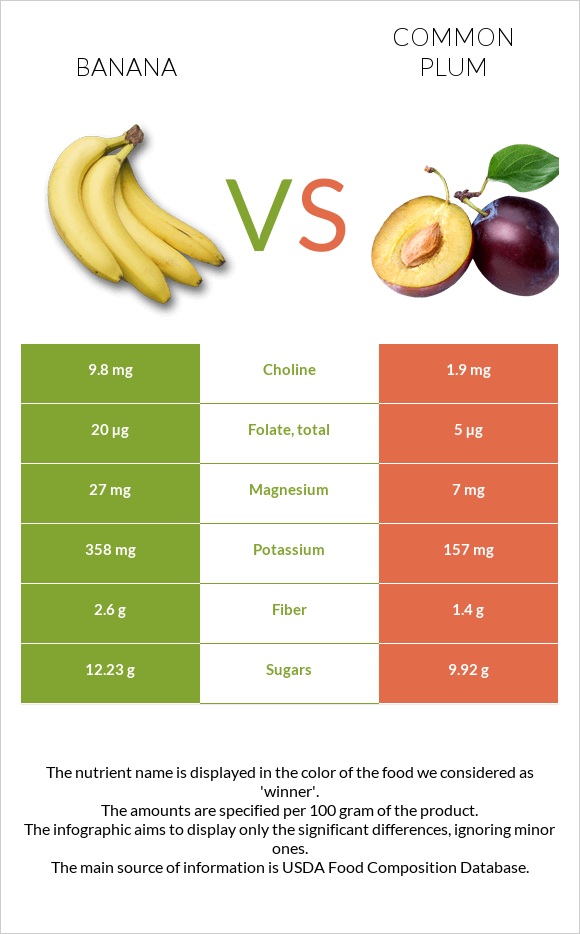
How are bananas and plums different? Bananas are higher in vitamin B6, manganese, and potassium; however, plums are richer in vitamin A. Daily need coverage for vitamin B6 for bananas is 26% higher. Bananas contain 5 times more manganese than plums. While bananas contain 0.27mg of manganese, plums contain only 0.052mg. Plums have less sugar. Bananas, raw and Plums, raw are the varieties used in this article.
Infographic
Mineral Comparison
Mineral comparison score is based on the number of minerals by which one or the other food is richer. The "coverage" charts below show how much of the daily needs can be covered by 300 grams of the food.
8
100 g
300 g
1 extra small (less than 6" long) - 81g 1 small (6" to 6-7/8" long) - 101g 1 medium (7" to 7-7/8" long) - 118g 1 NLEA serving - 126g 1 large (8" to 8-7/8" long) - 136g 1 cup, sliced - 150g 1 extra large (9" or longer) - 152g 1 cup, mashed - 225g
Magnesium
Magnesium
Calcium
Calcium
Potassium
Potassium
Iron
Iron
Copper
Copper
Zinc
Zinc
Phosphorus
Phosphorus
Sodium
Sodium
Manganese
Manganese
Selenium
Selenium
19%
1.5%
32%
9.8%
26%
4.1%
9.4%
0.13%
35%
5.5%
2
100 g
300 g
1 fruit (2-1/8" dia) - 66g 1 NLEA serving - 151g 1 cup, sliced - 165g
Magnesium
Magnesium
Calcium
Calcium
Potassium
Potassium
Iron
Iron
Copper
Copper
Zinc
Zinc
Phosphorus
Phosphorus
Sodium
Sodium
Manganese
Manganese
Selenium
Selenium
5%
1.8%
14%
6.4%
19%
2.7%
6.9%
0%
6.8%
0%
Vitamin Comparison
Vitamin comparison score is based on the number of vitamins by which one or the other food is richer. The "coverage" charts below show how much of the daily needs can be covered by 300 grams of the food.
5
100 g
300 g
1 extra small (less than 6" long) - 81g 1 small (6" to 6-7/8" long) - 101g 1 medium (7" to 7-7/8" long) - 118g 1 NLEA serving - 126g 1 large (8" to 8-7/8" long) - 136g 1 cup, sliced - 150g 1 extra large (9" or longer) - 152g 1 cup, mashed - 225g
Vitamin C
Vit. C
Vitamin D
Vit. D
Vitamin A
Vit. A
Vitamin E
Vit. E
Vitamin B1
Vit. B1
Vitamin B2
Vit. B2
Vitamin B3
Vit. B3
Vitamin B5
Vit. B5
Vitamin B6
Vit. B6
Vitamin B12
Vit. B12
Vitamin K
Vit. K
Folate
Folate
29%
0%
1%
2%
7.8%
17%
12%
20%
85%
0%
1.3%
15%
3
100 g
300 g
1 fruit (2-1/8" dia) - 66g 1 NLEA serving - 151g 1 cup, sliced - 165g
Vitamin C
Vit. C
Vitamin D
Vit. D
Vitamin A
Vit. A
Vitamin E
Vit. E
Vitamin B1
Vit. B1
Vitamin B2
Vit. B2
Vitamin B3
Vit. B3
Vitamin B5
Vit. B5
Vitamin B6
Vit. B6
Vitamin B12
Vit. B12
Vitamin K
Vit. K
Folate
Folate
32%
0%
5.7%
5.2%
7%
6%
7.8%
8.1%
6.7%
0%
16%
3.8%
All nutrients comparison - raw data values
Nutrient
DV% diff.
Vitamin B6
0.367mg
0.029mg
26%
Manganese
0.27mg
0.052mg
9%
Potassium
358mg
157mg
6%
Magnesium
27mg
7mg
5%
Fiber
2.6g
1.4g
5%
Vitamin K
0.5µg
6.4µg
5%
Carbs
22.84g
11.42g
4%
Vitamin B2
0.073mg
0.026mg
4%
Vitamin B5
0.334mg
0.135mg
4%
Folate
20µg
5µg
4%
Calories
89kcal
46kcal
2%
Copper
0.078mg
0.057mg
2%
Starch
5.38g
0g
2%
Vitamin A
3µg
17µg
2%
Selenium
1µg
0µg
2%
Vitamin B3
0.665mg
0.417mg
2%
Fructose
4.85g
3.07g
2%
Protein
1.09g
0.7g
1%
Vitamin C
8.7mg
9.5mg
1%
Iron
0.26mg
0.17mg
1%
Phosphorus
22mg
16mg
1%
Vitamin E
0.1mg
0.26mg
1%
Choline
9.8mg
1.9mg
1%
Protein per 100 calories
1.2g
1.5g
N/A
Calories per 10 g protein
817kcal
657kcal
N/A
Weight per 100 calories
112g
217g
N/A
Fats
0.33g
0.28g
0%
Net carbs
20.24g
10.02g
N/A
Calcium
5mg
6mg
0%
Sugar
12.23g
9.92g
N/A
Zinc
0.15mg
0.1mg
0%
Sodium
1mg
0mg
0%
Vitamin B1
0.031mg
0.028mg
0%
Saturated fat
0.112g
0.017g
0%
Monounsaturated fat
0.032g
0.134g
0%
Polyunsaturated fat
0.073g
0.044g
0%
Tryptophan
0.009mg
0.009mg
0%
Threonine
0.028mg
0.01mg
0%
Isoleucine
0.028mg
0.014mg
0%
Leucine
0.068mg
0.015mg
0%
Lysine
0.05mg
0.016mg
0%
Methionine
0.008mg
0.008mg
0%
Phenylalanine
0.049mg
0.014mg
0%
Valine
0.047mg
0.016mg
0%
Histidine
0.077mg
0.009mg
0%
Macronutrient Comparison
Macronutrient breakdown side-by-side comparison
4
23%
75%
Protein:
1.09 g
Fats:
0.33 g
Carbs:
22.84 g
Water:
74.91 g
Other:
0.83 g
1
11%
87%
Protein:
0.7 g
Fats:
0.28 g
Carbs:
11.42 g
Water:
87.23 g
Other:
0.37 g
Contains
more
Protein Protein
+55.7%
Contains
more
Fats Fats
+17.9%
Contains
more
Carbs Carbs
+100%
Contains
more
Other Other
+124.3%
Contains
more
Water Water
+16.4%
Fat Type Comparison
Fat type breakdown side-by-side comparison
1
52%
15%
34%
Saturated fat:
Sat. Fat
0.112 g
Monounsaturated fat:
Mono. Fat
0.032 g
Polyunsaturated fat:
Poly. Fat
0.073 g
2
9%
69%
23%
Saturated fat:
Sat. Fat
0.017 g
Monounsaturated fat:
Mono. Fat
0.134 g
Polyunsaturated fat:
Poly. Fat
0.044 g
Contains
more
Poly. Fat Polyunsaturated fat
+65.9%
Contains
less
Sat. Fat Saturated fat
-84.8%
Contains
more
Mono. Fat Monounsaturated fat
+318.8%
Carbohydrate type comparison
Carbohydrate type breakdown side-by-side comparison
3
31%
14%
28%
28%
Starch:
5.38 g
Sucrose:
2.39 g
Glucose:
4.98 g
Fructose:
4.85 g
Lactose:
0 g
Maltose:
0.01 g
Galactose:
0 g
3
16%
51%
31%
Starch:
0 g
Sucrose:
1.57 g
Glucose:
5.07 g
Fructose:
3.07 g
Lactose:
0 g
Maltose:
0.08 g
Galactose:
0.14 g
Contains
more
Starch Starch
+∞%
Contains
more
Sucrose Sucrose
+52.2%
Contains
more
Fructose Fructose
+58%
Contains
more
Maltose Maltose
+700%
Contains
more
Galactose Galactose
+∞%
~equal in
Glucose
~5.07g
~equal in
Lactose
~0g