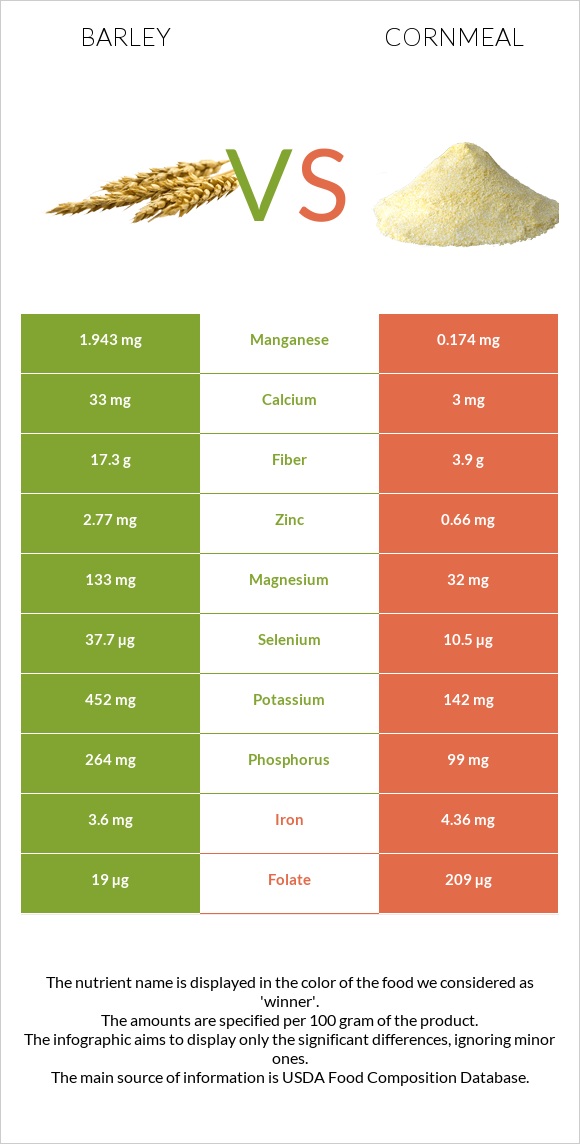
What are the main differences between barley and cornmeal? Barley is richer in manganese, fiber, selenium, copper, magnesium, phosphorus, zinc, and vitamin B6, yet cornmeal is richer in folate and iron. Barley's daily need coverage for manganese is 77% higher. Barley has 7 times more copper than cornmeal. Barley has 0.498mg of copper, while cornmeal has 0.076mg. Barley has a lower glycemic index than cornmeal. We used Barley, hulled and Cornmeal, degermed, enriched, yellow types in this comparison.
Infographic
Mineral Comparison
Mineral comparison score is based on the number of minerals by which one or the other food is richer. The "coverage" charts below show how much of the daily needs can be covered by 300 grams of the food.
8
100 g
300 g
1 cup - 184g
Magnesium
Magnesium
Calcium
Calcium
Potassium
Potassium
Iron
Iron
Copper
Copper
Zinc
Zinc
Phosphorus
Phosphorus
Sodium
Sodium
Manganese
Manganese
Selenium
Selenium
95%
9.9%
40%
135%
166%
76%
113%
1.6%
253%
206%
2
100 g
300 g
1 cup - 157g
Magnesium
Magnesium
Calcium
Calcium
Potassium
Potassium
Iron
Iron
Copper
Copper
Zinc
Zinc
Phosphorus
Phosphorus
Sodium
Sodium
Manganese
Manganese
Selenium
Selenium
23%
0.9%
13%
164%
25%
18%
42%
0.91%
23%
57%
Vitamin Comparison
Vitamin comparison score is based on the number of vitamins by which one or the other food is richer. The "coverage" charts below show how much of the daily needs can be covered by 300 grams of the food.
5
100 g
300 g
1 cup - 184g
Vitamin C
Vit. C
Vitamin D
Vit. D
Vitamin A
Vit. A
Vitamin E
Vit. E
Vitamin B1
Vit. B1
Vitamin B2
Vit. B2
Vitamin B3
Vit. B3
Vitamin B5
Vit. B5
Vitamin B6
Vit. B6
Vitamin B12
Vit. B12
Vitamin K
Vit. K
Folate
Folate
0%
0%
0.33%
11%
162%
66%
86%
17%
73%
0%
5.5%
14%
3
100 g
300 g
1 cup - 157g
Vitamin C
Vit. C
Vitamin D
Vit. D
Vitamin A
Vit. A
Vitamin E
Vit. E
Vitamin B1
Vit. B1
Vitamin B2
Vit. B2
Vitamin B3
Vit. B3
Vitamin B5
Vit. B5
Vitamin B6
Vit. B6
Vitamin B12
Vit. B12
Vitamin K
Vit. K
Folate
Folate
0%
0%
3.7%
2.4%
138%
88%
93%
14%
42%
0%
0%
157%
All nutrients comparison - raw data values
Nutrient
DV% diff.
Manganese
1.943mg
0.174mg
77%
Fiber
17.3g
3.9g
54%
Selenium
37.7µg
10.5µg
49%
Folate
19µg
209µg
48%
Copper
0.498mg
0.076mg
47%
Starch
73.3g
30%
Magnesium
133mg
32mg
24%
Phosphorus
264mg
99mg
24%
Zinc
2.77mg
0.66mg
19%
Protein
12.48g
7.11g
11%
Iron
3.6mg
4.36mg
10%
Vitamin B6
0.318mg
0.182mg
10%
Potassium
452mg
142mg
9%
Vitamin B1
0.646mg
0.551mg
8%
Vitamin B2
0.285mg
0.382mg
7%
Calcium
33mg
3mg
3%
Vitamin E
0.57mg
0.12mg
3%
Carbs
73.48g
79.45g
2%
Vitamin B3
4.604mg
4.968mg
2%
Vitamin K
2.2µg
0µg
2%
Choline
8.6mg
2%
Polyunsaturated fat
1.108g
0.828g
2%
Calories
354kcal
370kcal
1%
Fats
2.3g
1.75g
1%
Vitamin A
1µg
11µg
1%
Vitamin B5
0.282mg
0.24mg
1%
Saturated fat
0.482g
0.22g
1%
Protein per 100 calories
3.5g
1.9g
N/A
Calories per 10 g protein
284kcal
520kcal
N/A
Weight per 100 calories
28g
27g
N/A
Unsaturated / Saturated Fat ratio
2.9
5.5
N/A
Net carbs
56.18g
75.55g
N/A
Sugar
0.8g
1.61g
N/A
Sodium
12mg
7mg
0%
Monounsaturated fat
0.295g
0.39g
0%
Tryptophan
0.208mg
0.038mg
0%
Threonine
0.424mg
0.172mg
0%
Isoleucine
0.456mg
0.242mg
0%
Leucine
0.848mg
1.006mg
0%
Lysine
0.465mg
0.105mg
0%
Methionine
0.24mg
0.162mg
0%
Phenylalanine
0.7mg
0.366mg
0%
Valine
0.612mg
0.337mg
0%
Histidine
0.281mg
0.172mg
0%
Fructose
0.17g
0%
Macronutrient Comparison
Macronutrient breakdown side-by-side comparison
3
12%
2%
73%
9%
2%
Protein:
12.48 g
Fats:
2.3 g
Carbs:
73.48 g
Water:
9.44 g
Other:
2.3 g
2
7%
2%
79%
11%
Protein:
7.11 g
Fats:
1.75 g
Carbs:
79.45 g
Water:
11.18 g
Other:
0.51 g
Contains
more
Protein Protein
+75.5%
Contains
more
Fats Fats
+31.4%
Contains
more
Other Other
+351%
Contains
more
Water Water
+18.4%
Fat Type Comparison
Fat type breakdown side-by-side comparison
1
26%
16%
59%
Saturated fat:
Sat. Fat
0.482 g
Monounsaturated fat:
Mono. Fat
0.295 g
Polyunsaturated fat:
Poly. Fat
1.108 g
2
15%
27%
58%
Saturated fat:
Sat. Fat
0.22 g
Monounsaturated fat:
Mono. Fat
0.39 g
Polyunsaturated fat:
Poly. Fat
0.828 g
Contains
more
Poly. Fat Polyunsaturated fat
+33.8%
Contains
less
Sat. Fat Saturated fat
-54.4%
Contains
more
Mono. Fat Monounsaturated fat
+32.2%